Custom Charts makes it easy to build customized dashboard reports, charts, graphs, and more. By combining Structure and Custom Charts, you can build custom reports to cover your work, your projects, or even your entire portfolio.
Build Custom Charts for a Structure
To build custom charts based on a structure:
-
Make sure Structure and Custom Charts for Jira and/or Custom Charts for Confluence are installed.
-
Add the Dashboard/Macro:
-
From the Jira Dashboard editor screen, click Add gadget and search for Custom Charts. Select the first gadget from the list: Custom Charts.
-
From a Confluence page, click the Insert Elements button and search for Custom Jira Charts.
-
-
In the newly created gadget, open the Source dropdown and select Structure.
-
Select the structure or structures you want to use for your chart. The resulting chart will be based on all the work items in the selected structure(s).
-
Customize your chart. For more information, see Build your first Custom Chart.
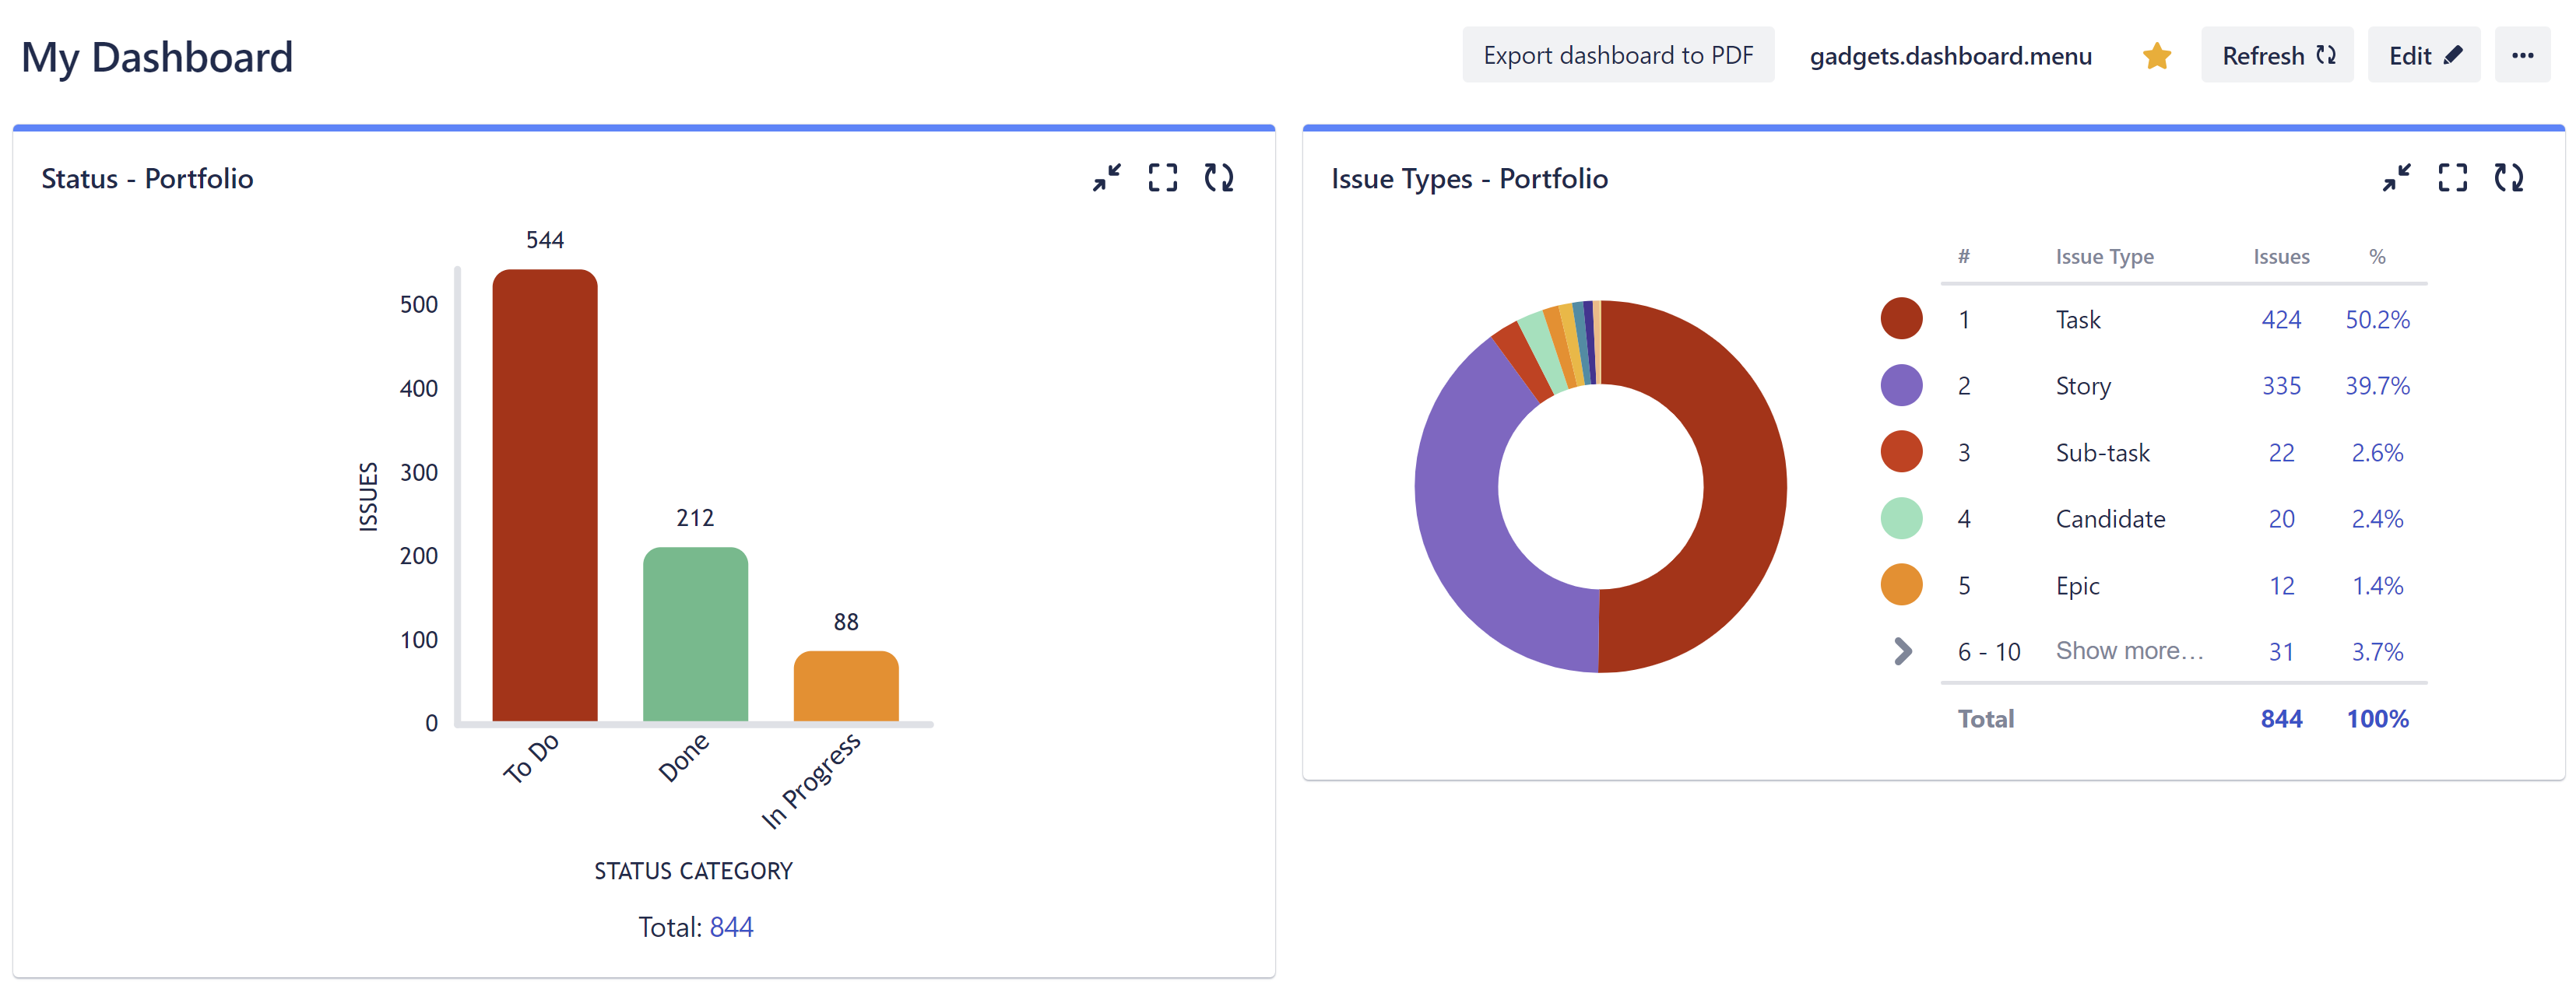
Reporting for Your Entire Portfolio
Adding Custom Charts to your Strategy collection lets you build custom reports to track your entire portfolio - or even just your piece of it.
To create reports for your entire portfolio, use the structure integrated with your Strategic Roadmaps roadmap.
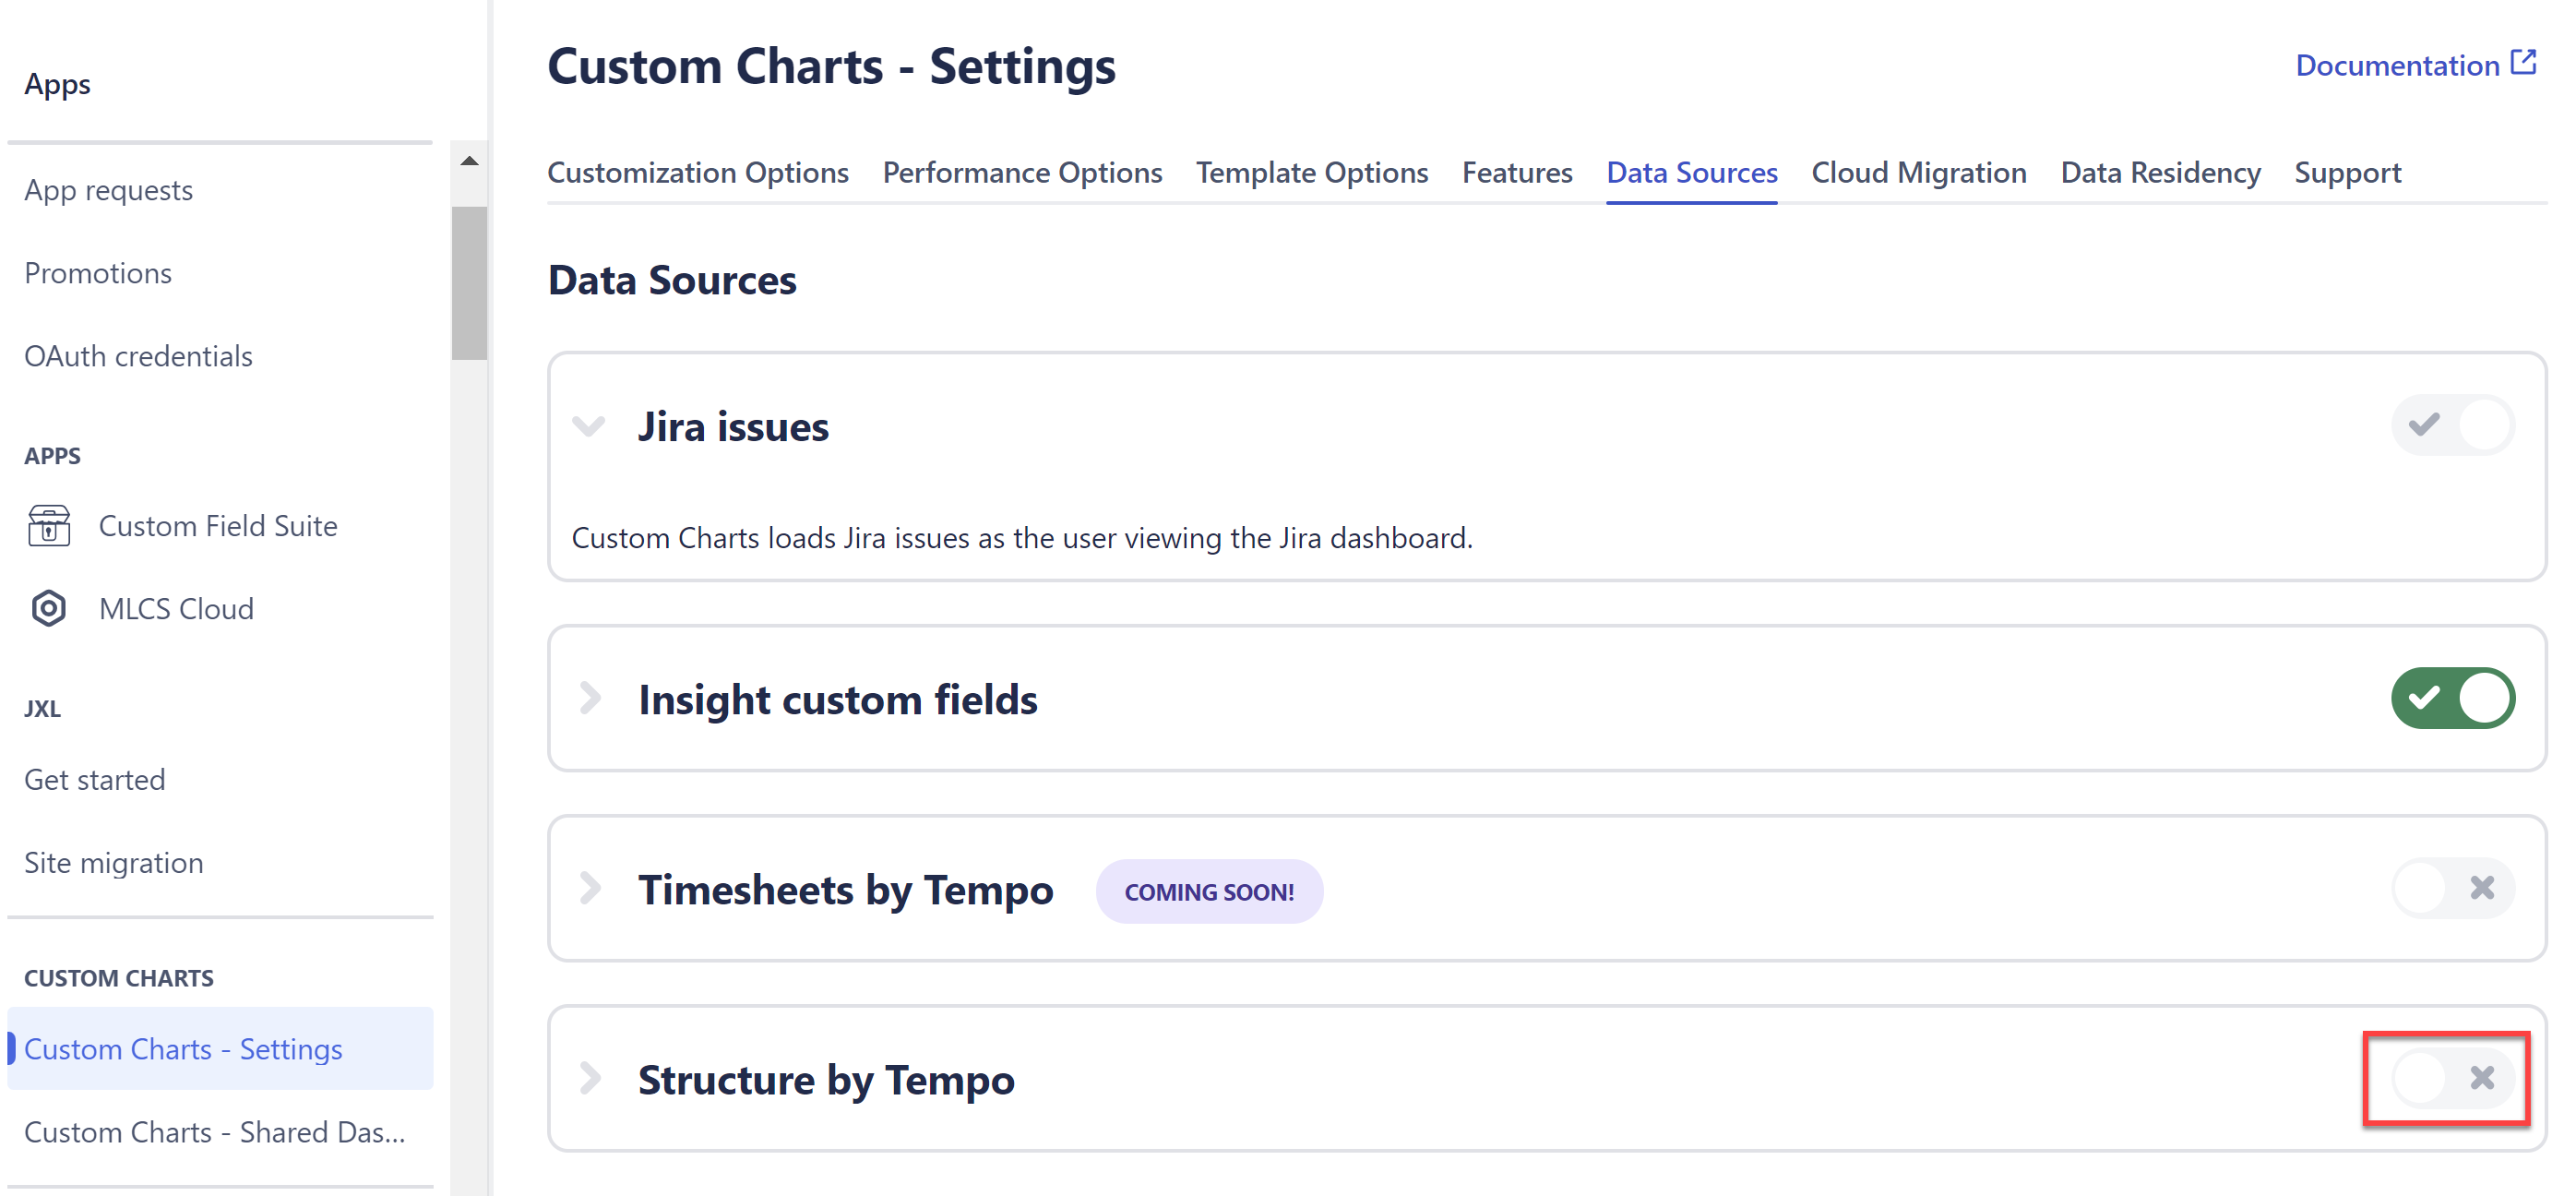
Enable Structure as a Data Source
If you aren't able to select Structure in the Source menu, ask your Jira Admin to enable Structure as a data source for Custom Charts.
To do this, go to Settings | Apps | Custom Charts | Data Sources and enable Structure.