Extend built-in Jira timetracking—configurable reports for users and groups are at the heart of Timesheet Reports & Gadgets for Jira Server and Data Center. You can configure each report, allowing you to analyze your Jira data to help you see trends and plan future projects more efficiently.
See the procedures below to learn how to access reports and gadgets, export reports, and subscribe to reports by email. Follow the links below under In this section to see details about each of the reports and gadgets.
To access reports:
-
Navigate to Projects > your project > Reports > Other.
-
Select the report to open: Project Pivot Report, Time Sheet Report, or Timespent Report.
-
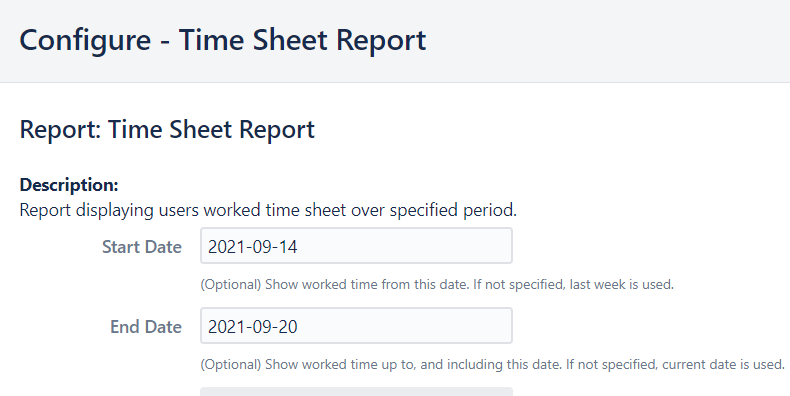
Once a report is selected, the Configure settings are displayed.
Choose the settings to apply to the report, and then click Next to display the report.
-
To change any of the settings, click Change above the report, or Configure at the top right of each report page to access the configuration settings.
To access gadgets:
-
Navigate to Administration > System > User Interface > System Dashboard.
-
Click Add gadget.
-
Use the Search box to search for the gadget you want to add: Project Pivot, Time Sheet, Timespent, or Worked Time Chart. and click Add gadget beside the result.
You can add multiple gadgets by repeating this step. The gadgets can be configured once you are back on the Configure System Dashboard page.
-
For each gadget that you added, optionally a title and edit any other report settings.
-
Click Save.
-
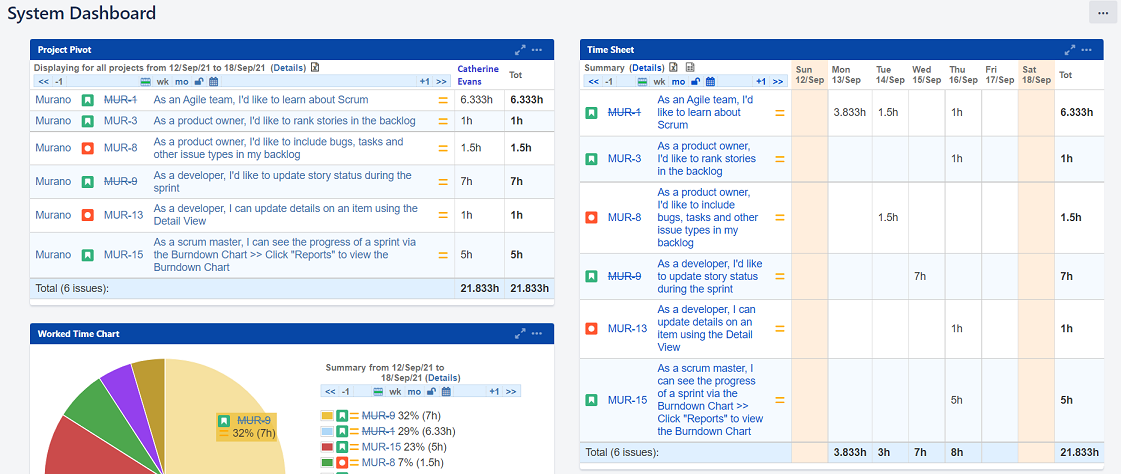
Once you return to the dashboard, the gadget is displayed.
Use the Jira dashboard settings to set up the look of your dashboard (Administration > System > User Interface > System Dashboard > Edit layout).
-
Once the gadget is set up, you can interact with the report directly in the dashboard.
For example, in the Times Sheet gadget, you can change the week displayed, log time, or access issues. If you need to access the full report page, click Details.
To export reports to Excel:
-
Set up the report for how you want to export. You can use the Columns For Export setting in the Configuration Settings to specify what you want in the export.
If nothing is selected, the default columns are processed.
-
Click Export to Excel above the report.

-
Change the file name, if needed, and select the destination.
There are also options to the top right on the Time Sheet report to export a CSV View or Excel View, and in the Project Pivot report to export the Excel View.
To subscribe to reports by email:
-
On the report page for a supported report, click Subscribe.
You can also click Send Now to send the report on an as-needed basis.
-
By default, the report is scheduled to send on the day after the End Date day of the report at 4 a.m.
-
The currently logged-in user can view all of their subscriptions, update schedules, or unsubscribe in Issues > Timesheet > Subscriptions.
An admin can manage all subscriptions (edit the schedule and who the report is sent to) in Administration > Manage apps > Time Tracking > Timesheet Subscriptions.