The Worked Time Chart gadget in Timesheet Reports & Gadgets for Jira Server and Data Center displays a visual summary of worked time for a project for a defined period, in a familiar pie chart view.
Worked Time Chart is available as gadget only.
-
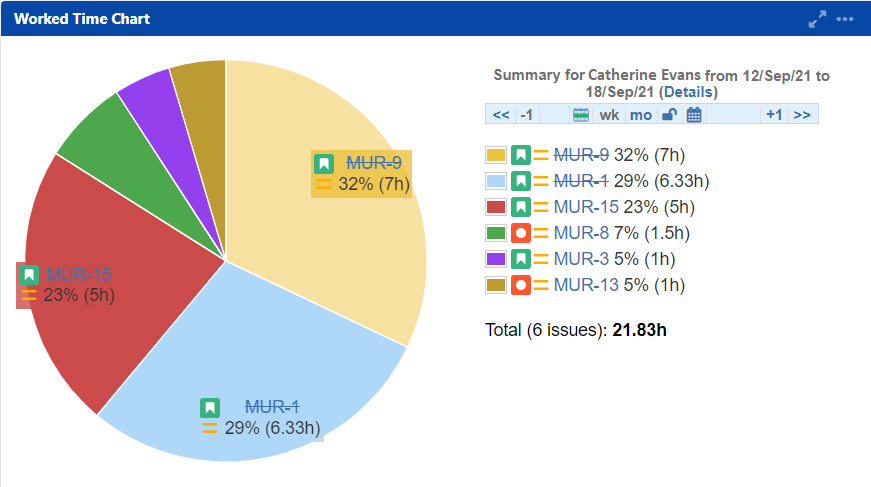
Issues for the selected period are displayed as wedges, sized according to the percentage of time worked.
-
Click any issue number in the chart or list to access the full issue.
-
Use the icons above the issue list to select the time to display.
-
Click Details to access the Time Sheet report, where you can change configuration settings, for example for Projects or Role. Return to the Dashboard to see the updated Worked Time Chart gadget.