-
Viewing time records for team members requires the View Team Worklogs permission and the Browse Projects permission for each project.
-
Viewing plans for team members requires the View Team Plans permission.
-
You need to have Tempo Planner version 7.15 or later and Tempo Timesheets version 10.15 or later installed to generate the Planned vs Actual report.
The Planned vs. Actual report shows the time you have planned for your projects and compares it with the actual time team members have logged in their timesheets. This report helps managers, teams, and leads to monitor the progress of their projects, and based on the numbers collected from this report, they can alter future forecasts.
Team Plans Are Not Included in Report
This report includes individual (user) plans and does not include team plans.
Watch this video to see how to run a Planned vs Actual report on Tempo for Cloud. All functions are essentially the same on Tempo for Server:
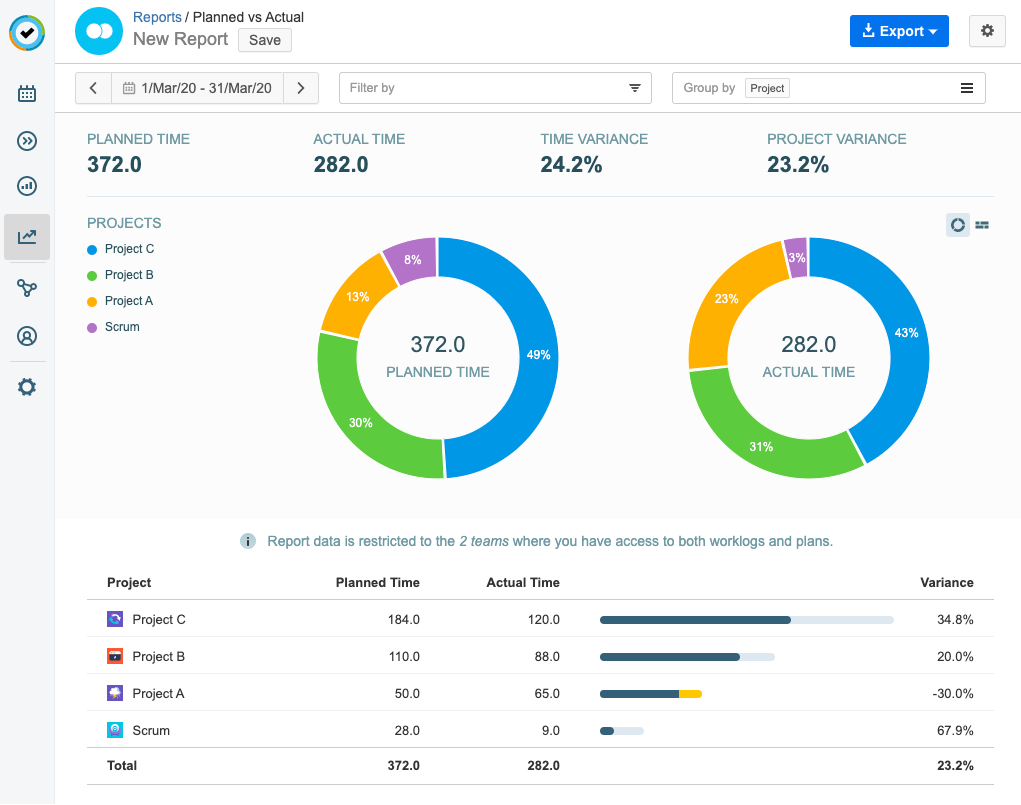
Create the report by selecting Planned vs Actual in the Reports overview. Before running the report, you can apply filters to drill down the data, and select whether to compare by user, epic, role, account, or project. You can also use the Filter by and Group by boxes to drill down the information after you have created the report. The report shows results for teams where you have the permission to view worklogs AND plans. Note that if you have the permission to View All Worklogs in projects that are not linked to your team, logged time for those projects will also be included in the report.
-
By default, the report shows data for the current time period. You can use the time box in the upper-left corner to adjust the date range for which information is displayed.
-
Planned Time is the total time planned for the selected date range. In the example above 372 hours have been planned for the displayed projects.
-
Actual Time is the total time that has been logged for the selected date range. In the example above 282 hours have been logged on the displayed projects.
-
Time Variance is the percent variance between the total planned and actual hours. Negative numbers indicate that more time has been logged than the plan anticipated.
-
Group Variance is the average percent variance of the values in the table. In the example above the report is grouped by projects and the total Project Variance is the average percent variance of all projects.
-
The graph shows planned time and actual time as a percentage of total time. Hover over the graph to see the total for each item. The report can display a donut or a bar chart, and you can use the toggle to switch between the two as you choose.
-
The table shows total planned and actual hours both as numbers and bars: the dark-shaded portion of each bar represents the actual hours logged whereas the light-shaded portion represents planned hours. Logged hours that exceed planned hours are represented in a yellow color.
-
You can save the report to run it again later. Saved reports are stored in the Reports overview and can be accessed from there. For more information about saving reports, see Saving and Deleting Reports.
Printing the Report
You can export your report to be printed or saved as a PDF file.
To print the report:
-
On the Export menu to the upper right, select Print.
-
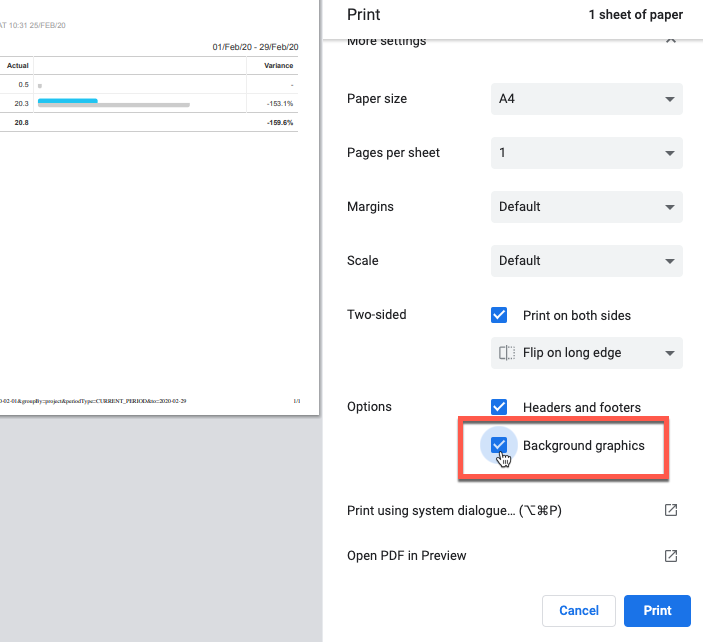
A preview of the report is displayed from where you can change the orientation of the report before printing. You can save the report to PDF using the browser print options.
Note
To display the graphics in the export, make sure that the Background graphics check-box is selected before printing.
-
When you are done, click Print.
Related Topics