Viewing time records for other team members requires the View All Worklogs and Browse Projects permission for each project. Viewing plans requires the View Team Plans permission.
To report on planned time, you need to have Tempo Planner version 7.8 or later and Tempo Timesheets version 10.8 or later installed.
You need to have Tempo Planner version 7.15 or later and Tempo Timesheets version 10.15 or later installed to generate the Planned vs Actual report.
You can create Logged Time reports to view time spent on projects, issues, epics, by team, user, etc. Before you run the report, you can apply filters to pin down what you need to see. You can also group the data to make it more accessible and easier to read. You can always change your filter settings and grouping options after the report is generated.
If you have Tempo Planner installed, you can also create Planned Time and Planned vs Actual reports showing how much time has been planned and compare the time that has been planned versus the actual time that was logged. You can refine the data by projects, teams, roles, accounts, etc.
To create reports, go to the Reports overview by selecting Reports in the Tempo sidebar. In the Reports overview you can also load your previously saved reports.
Creating Reports
-
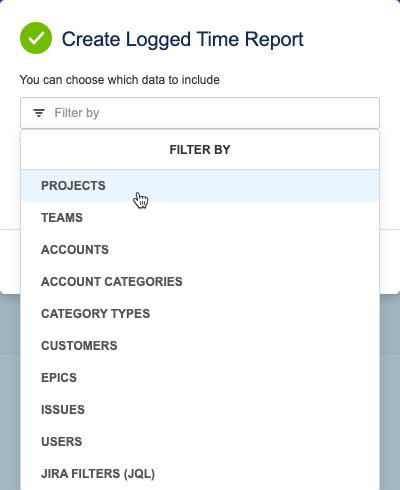
In the Reports overview, select the report type you want to generate.
-
In the pop-up that appears, click the Filter by box to display a list of filter options. For more information about how to filter report data, see Viewing Reports - Tempo Server.
-
When you are finished selecting your filters, click outside the pop-up to return to the Create Report dialog box.
-
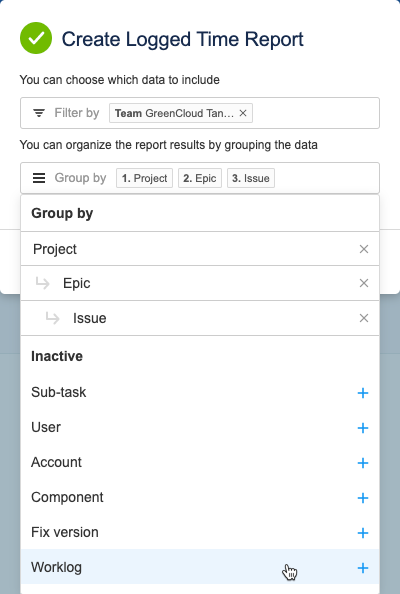
To organize the report results, click the Group by box to display grouping options. By default, Logged Time report data is grouped by project/user and Planned Time report data by user/plans. Tempo remembers your grouping configuration and will apply your selected groups the next time you generate a report.
-
You can select more than one item to group by. Items are organized according to Jira hierarchy.
-
To remove a grouping level, click the x for that level.
Grouping options are different for each report type.
-
-
When you are finished grouping the data, click outside the pop-up to return to the Create Report dialog box.
-
Click Create.
Loading Saved Reports
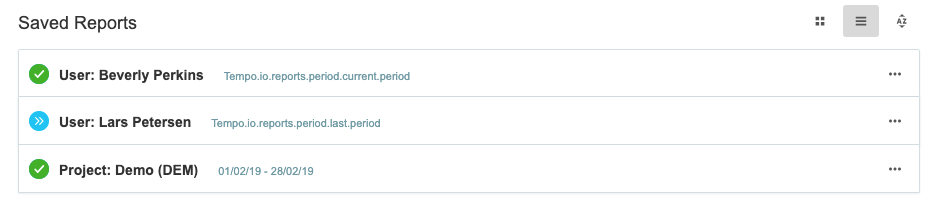
Your saved reports are stored in the Reports overview under Saved Reports. Next to the report name the reporting period is displayed, showing whether the report is dynamic or fixed. You can also hover the period to determine if the report is dynamic or fixed. For more information about dynamic and fixed reports, see Saving and Deleting Reports - Tempo Server.
By default, the saved reports are displayed in a grid, but you can also view them as a list. Use the buttons at the top-right of the Saved Reports section to switch between a grid and list view. You can sort your reports by Name, Date created, or Last viewed and display them in ascending or descending order. Click the <AZ> icon to see sorting options.
To load a saved report:
-
Simply click the report you want to load. Once loaded, you can customize the report by adding and removing filters, regrouping the data, changing the time period, etc.
-
When you are done working with your report, you can save your report. For more information about saving reports, see Saving and Deleting Reports - Tempo Server.
Related Topics