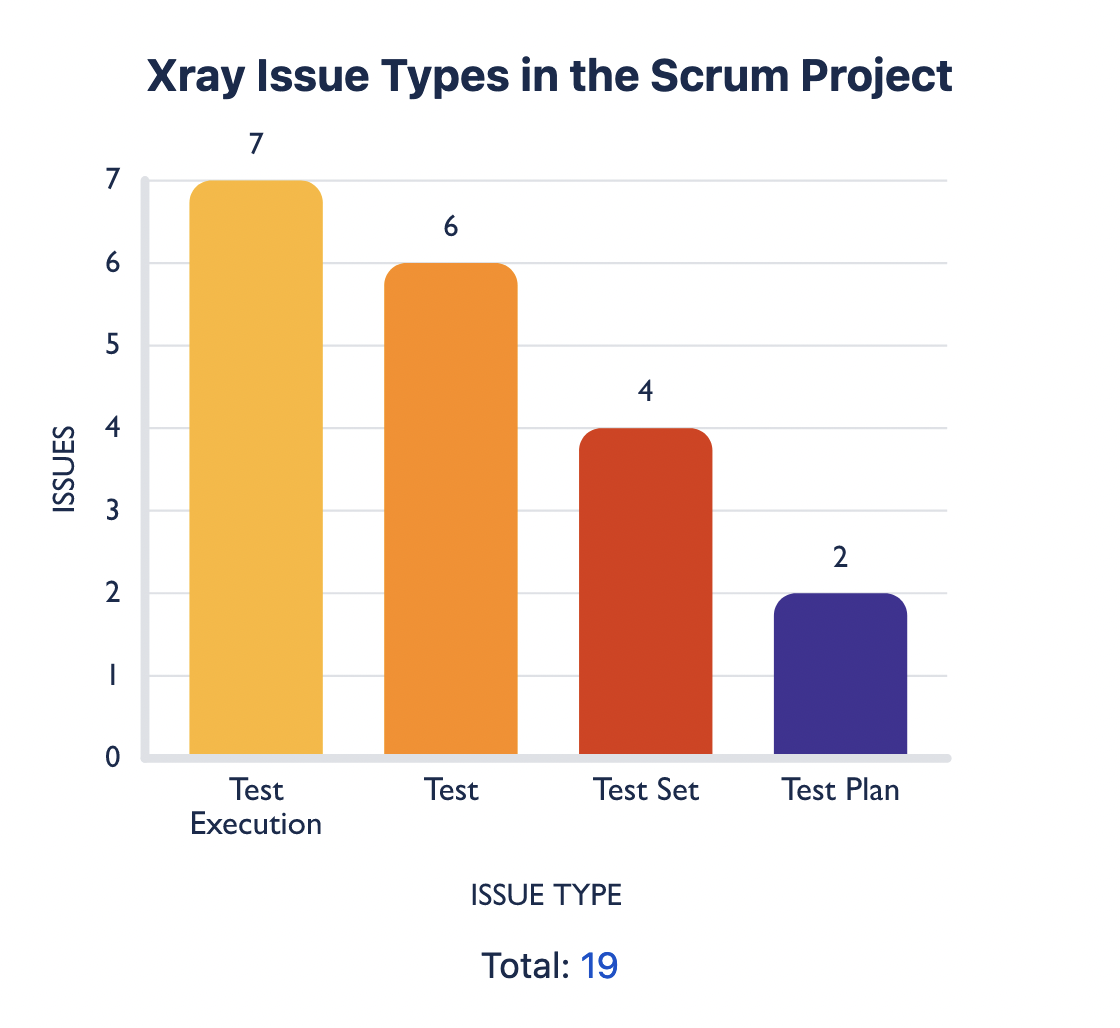
This chart shows the amount of issues in a project broken down by Xray issue type: Test Execution; Test; Test Set; Sub Test Execution; Test Plan; and Precondition.
Recreate this Chart in Your Instance
-
Set the Source to Advanced (JQL) and enter: xrayIssueType IS NOT empty
-
Set the Chart type to Bar Chart
-
Set the Chart by dropdown to Issue Type
-
Optional: Give your chart a title and combine or rename any segments
-
Click Save or Insert