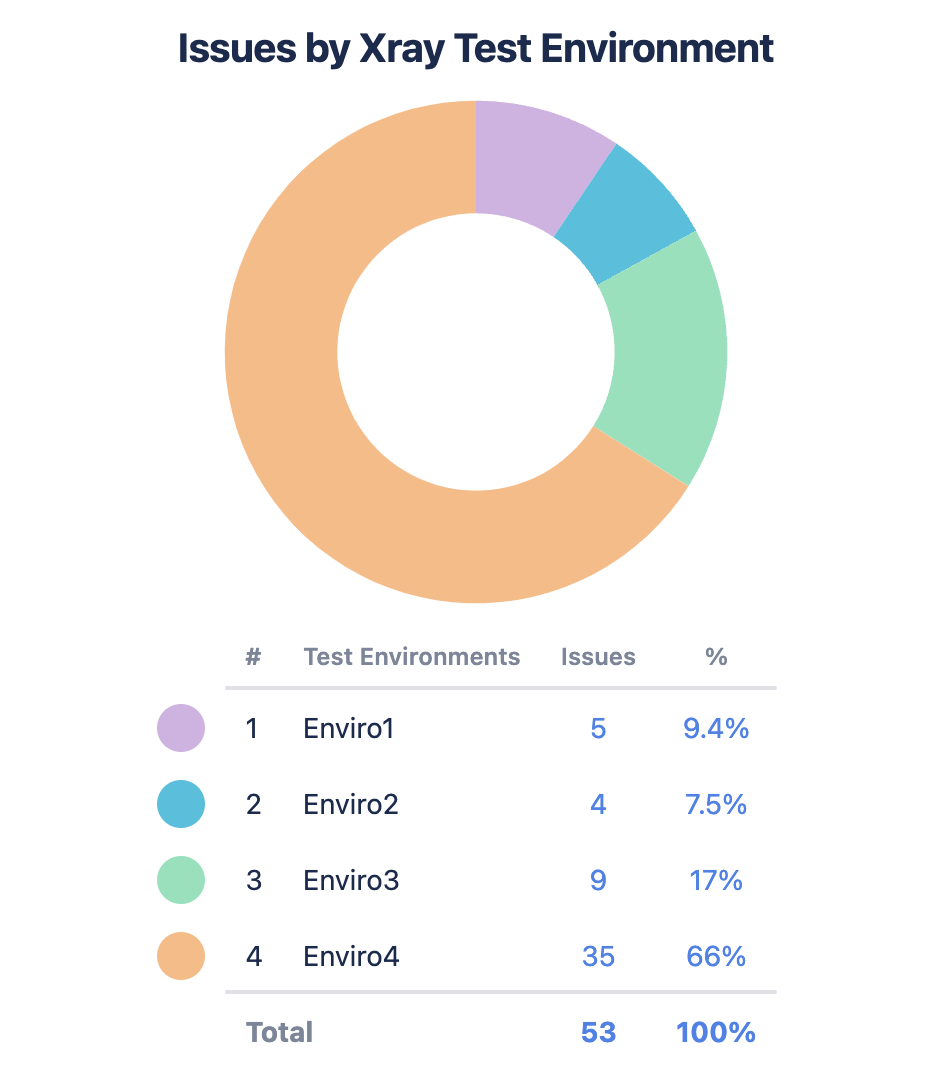
This chart shows the amount of issues in a project broken down by Xray Test Environment.
Recreate This Chart in Your Instance
-
Set the Source to Projects
-
Set the Chart type to Pie Chart
-
Set the Chart by dropdown to Test Environments
-
Optional: Give your chart a title and combine or rename any segments
-
Click Save or Insert