You must have Tempo Timesheets and Tempo Capacity Planner installed to access Planned vs. Actual reports.
You must have Tempo teams created to use the Planned vs Actual report.
You must create plans in Tempo Capacity Planner to get the correct data for comparing with logged time for the Planned vs Actual report. The data from Jira fields in work items (Start Date and Due Date) is not used.
Viewing worklogs for your team members in Tempo Reports requires the View Worklogs and Browse Projects permissions. To see worklogs for other users in a space, you need to have the View All Worklogs permission.
To report on planned time, you need to have Tempo Capacity Planner installed. Viewing plans requires the View Plans permission.
The Planned vs. Actual report is designed to help managers, teams, and team leads monitor the progress of their spaces. The report does so by:
-
Giving you insight into the time you have planned for your spaces using Tempo Capacity Planner.
-
Comparing it with the actual time team members have logged in their timesheets using Tempo Timesheets.
The Planned vs Actual report is particularly useful because it allows you to get insight into your space’s current status and alter future forecasts if necessary.
Team Plans Are Not Included in the Report
This report includes individual (user) plans and does not include team plans.
Creating a Planned vs Actual Report
When you create a report, select Planned vs Actual in the Reports overview.
-
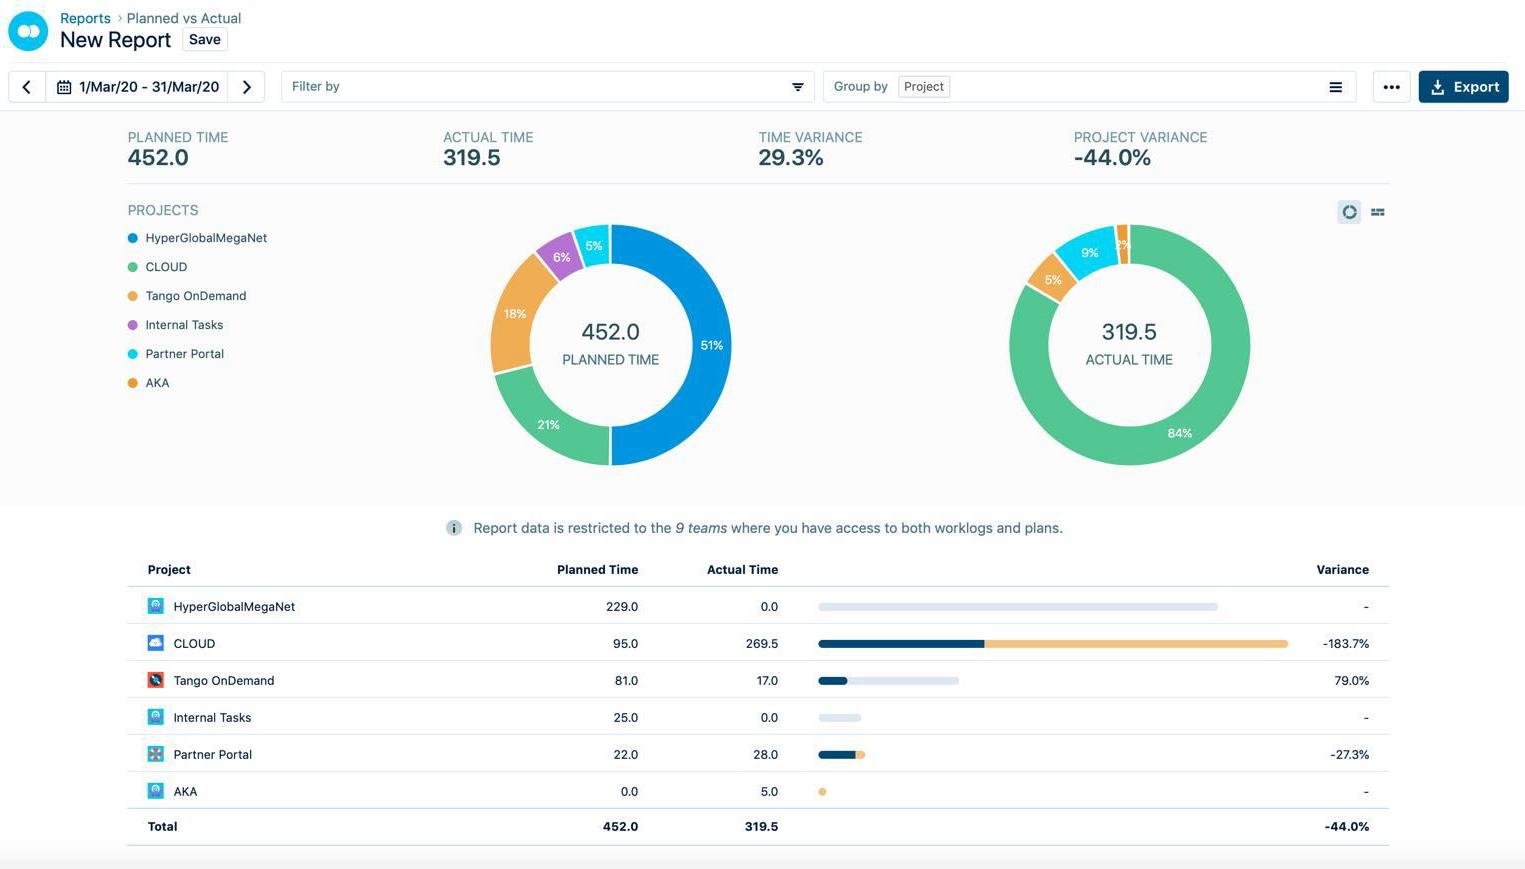
By default, the report shows data for the current time period. You can use the date box in the top left to adjust the date range for which information is displayed.
-
Planned Time is the total time planned for the selected date range. In the example above 452 hours have been planned for the displayed spaces. This is time that has come from plans created in Tempo Capacity Planner. Information from relevant fields in Jira work items (Start Date and Due Date) is not considered.
-
Actual Time is the total time that has been logged for the selected date range. In the example above 319.5 hours have been logged on the displayed spaces.
-
Time Variance is the percent variance between the total planned and actual hours. Negative numbers indicate that more time has been logged than the plan anticipated.
-
Group Variance is the average percent variance of the values in the table. In the example above, the report is grouped by spaces, and the total Space Variance is the average percent variance of all spaces.
-
The graph shows planned time and actual time as a percentage of total time. Hover over the graph to see the total for each item. The report can be displayed as a donut or bar chart, and you can switch between the two.
-
The table shows total planned and actual time both as numbers and bars: the dark-shaded portion of each bar represents the actual time logged, whereas the light-shaded portion represents planned time. If logged time exceeds planned time, it is shown in yellow.
The Planned vs. Actual report shows results for Tempo teams where you have the permission to View Worklogs AND View Plans. See Access Permissions for the Planned vs Actual Report for more information.
If you have the permission to View All Worklogs in Jira spaces that are not linked to your team, logged time for those spaces will also be included in the report.
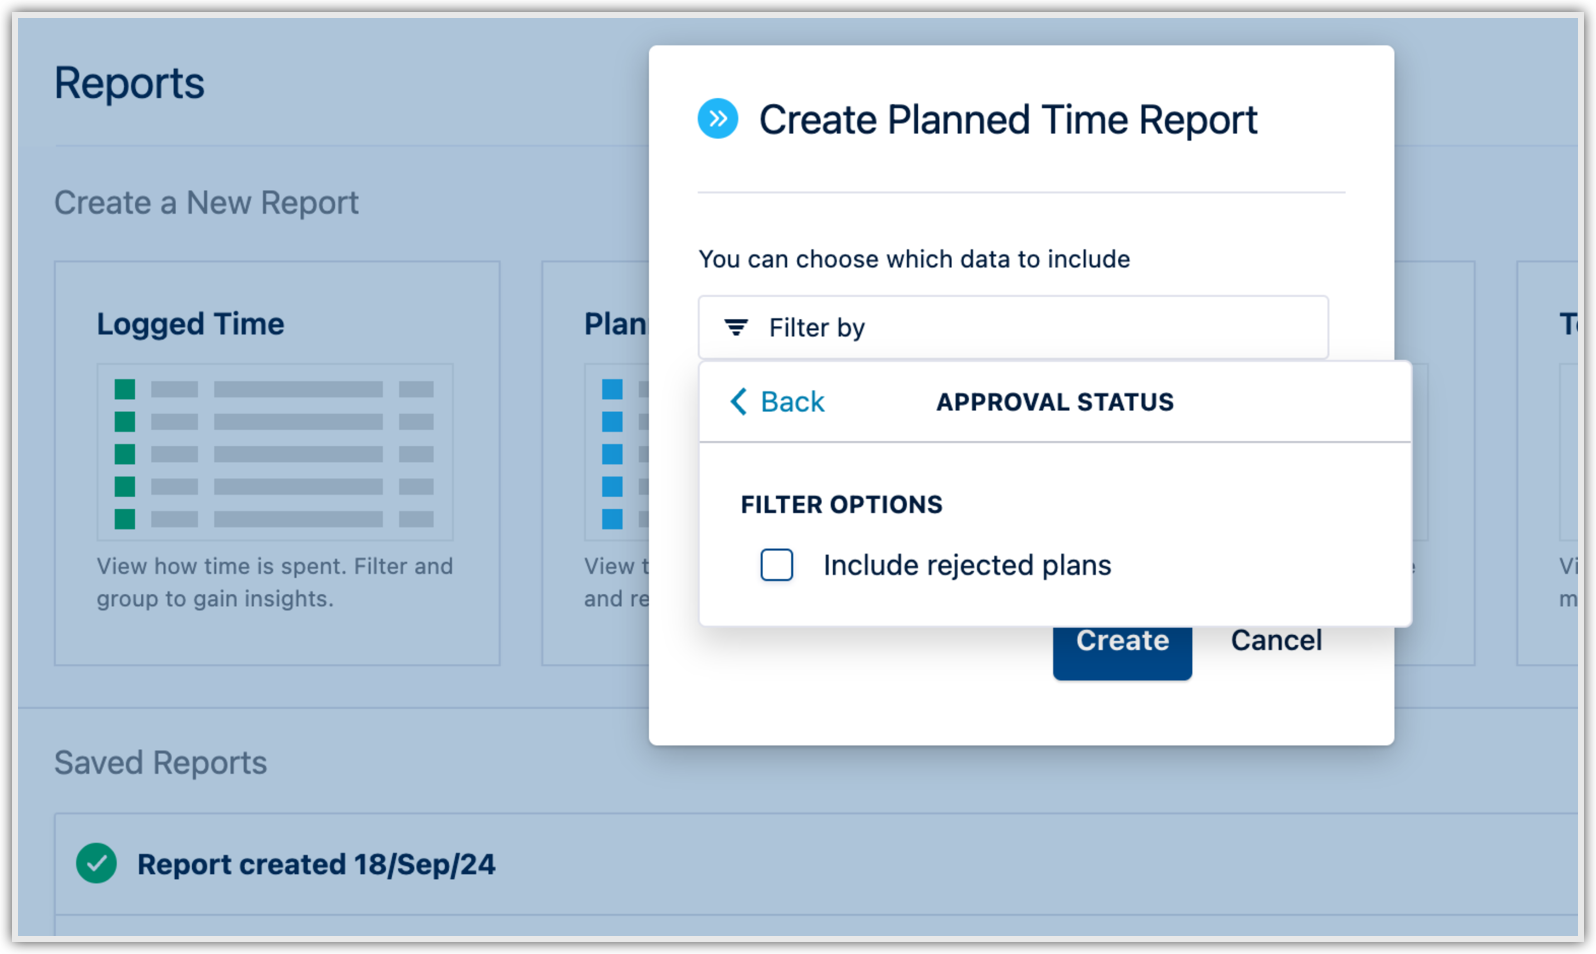
Filter to Include Rejected Plans in Your Reports
By default, rejected plans are not included in any Planned Time or Planned vs Actual reports that you generate. To include rejected plans in your reports, choose a filter called Approval Status and then select the Include rejected plans check box. You can choose this filter when you create a report and also when you view a report.