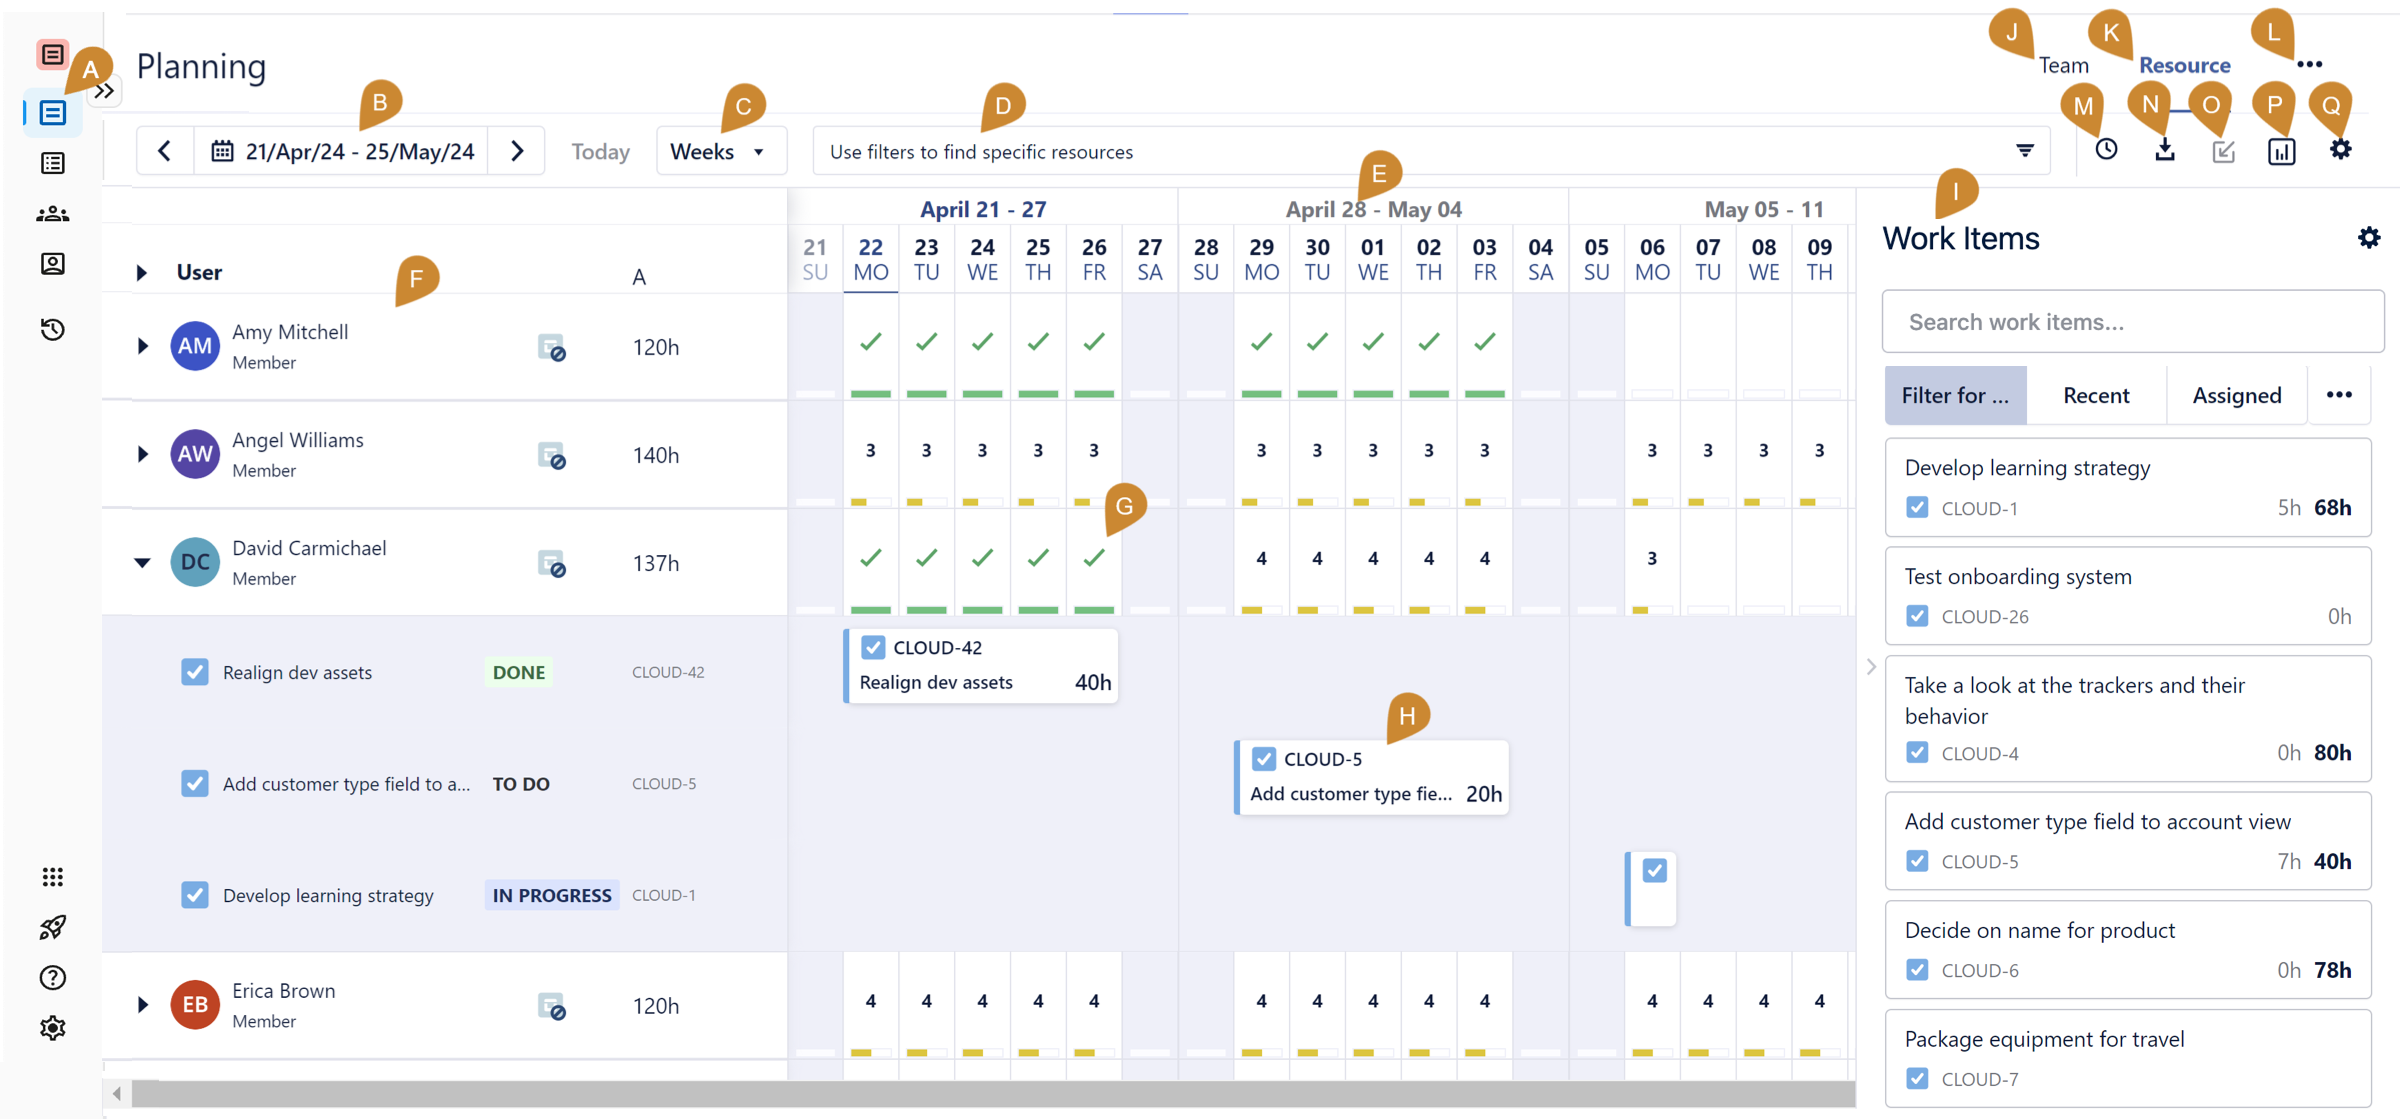
Viewing your resources in Resource Planning requires the View Plans permission for the teams to which the resources belong.
The Resource Planning view shows the availability of your resources and lets you see at a glance who's fully booked, who has available hours, and who is overbooked. The view shows all the members of the teams that are visible to you, but you can focus on who you want to see in the view by filtering the resources.
To open the Resource Planning view, select Planning in the Tempo sidebar. The Weeks view is displayed by default.

The Resource Planner
|
Element |
What is it? |
What does it do? |
|---|---|---|
|
A |
Planner icon |
Opens Tempo Capacity Planner to the Resource Planning view - what you're looking at here! |
|
B |
Planning period |
Select the time period for viewing and planning time:
See Selecting a Planning Period for more information. |
|
C |
View |
Switch between the Weeks and Days view. |
|
D |
Filter field |
Click in the Filter field to display a list of options for selecting who's displayed in the Resource Planning view - see Filtering Resources. |
|
E |
Calendar header |
Displays each day in the weeks that you have selected with the date picker (B). By default, 5 weeks from the start of the current week are displayed in the Weeks view, but you can choose to display any time period you like. To quickly switch to the Days view, click any week in this header. |
|
F |
Users |
View all users you have permission to view. You can filter the users displayed here using a filter you select in the Filter field (C). You can also view each user’s available hours from the current date to the future. Click the triangle > next to User or each user's name to expand them. When a user's plans are expanded, you can see the plans for each Jira work item and that work item's current status. See Viewing Resources and Their Plans for more information. |
|
G |
Calendar |
The main area for viewing and creating plans. Each resource has a timeline where you can see the number of hours that are planned for each day. Colored capacity indicators let you quickly see how their time is allocated:
Note that generic resources are always shown in green regardless of allocated hours, as they are not linked to a workload scheme. See Viewing Resources and Their Plans and Planning Time for Resources for more information. |
|
H |
Plans |
This is what it's all about! Create plans for each resource and view them - see Planning Time for Resources for more information. Click a plan to view its details or edit it - see Modifying Plans for more information. |
|
I |
Work Items side panel |
Displays Jira work items from predefined JQL searches. You can drag a work item from this panel onto a resource's timeline to create a plan. To expand and collapse the Work Items side panel, click the arrow in the middle of the right border. You can also toggle Show Work Items Side Panel from the View menu (J). See Finding work items with the work item Picker and Planning Time for Resources for more information. |
|
J |
Team |
Switches to the Team planning view. |
|
K |
Resource |
Switches to the Resource (user) planning view. |
|
L |
Additional options |
Open the Legacy Capacity Report. |
|
M |
Plan time |
Creates a plan. The Plan Time form opens without any information filled in yet - see Planning Time for Resources for more information. |
|
N |
Export Capacity Report |
Exports the Resource Planning data to a .CSV file format titled Capacity Report. |
|
O |
Import from Jira |
Creates plans from imported Jira work items. |
|
P |
View in Reports |
Generates a Planned Time report on the current data that you have filtered in the Resource Planning view. This is a quick way to get a report on exactly what you want! |
|
Q |
Settings |
Opens a menu with options that let you customize the Resource Planning view:
|
