Resource managers who are responsible for allocating resources to projects and tasks can report on the capacity of their resources, for small teams or large enterprises. When planning out for future projects, the report can show how many resources are needed and what type of skills are required. The user capacity export feature provides detailed data of available users and generic resources to help resource managers identify how feasible upcoming projects can be, based on the availability of full-time or part-time resources across roles and teams.
The exported capacity data can be imported and opened into a spreadsheet format where resource managers can drill down into the exported data to help them evaluate:
-
Project feasibility
-
Hiring needs
-
Resource availability
The exported capacity data includes only planned time data for generic resources. Capacity calculations require workload schemes, which are not available for generic resources.
Export Capacity to CSV Format
Filter the Resource Planning list by resources, teams, roles, etc., and export the result to a .CSV file format. The exported data can then be further analyzed and grouped as needed.
Watch our video for a quick demonstration on exporting capacity results.
To export resource capacity:
-
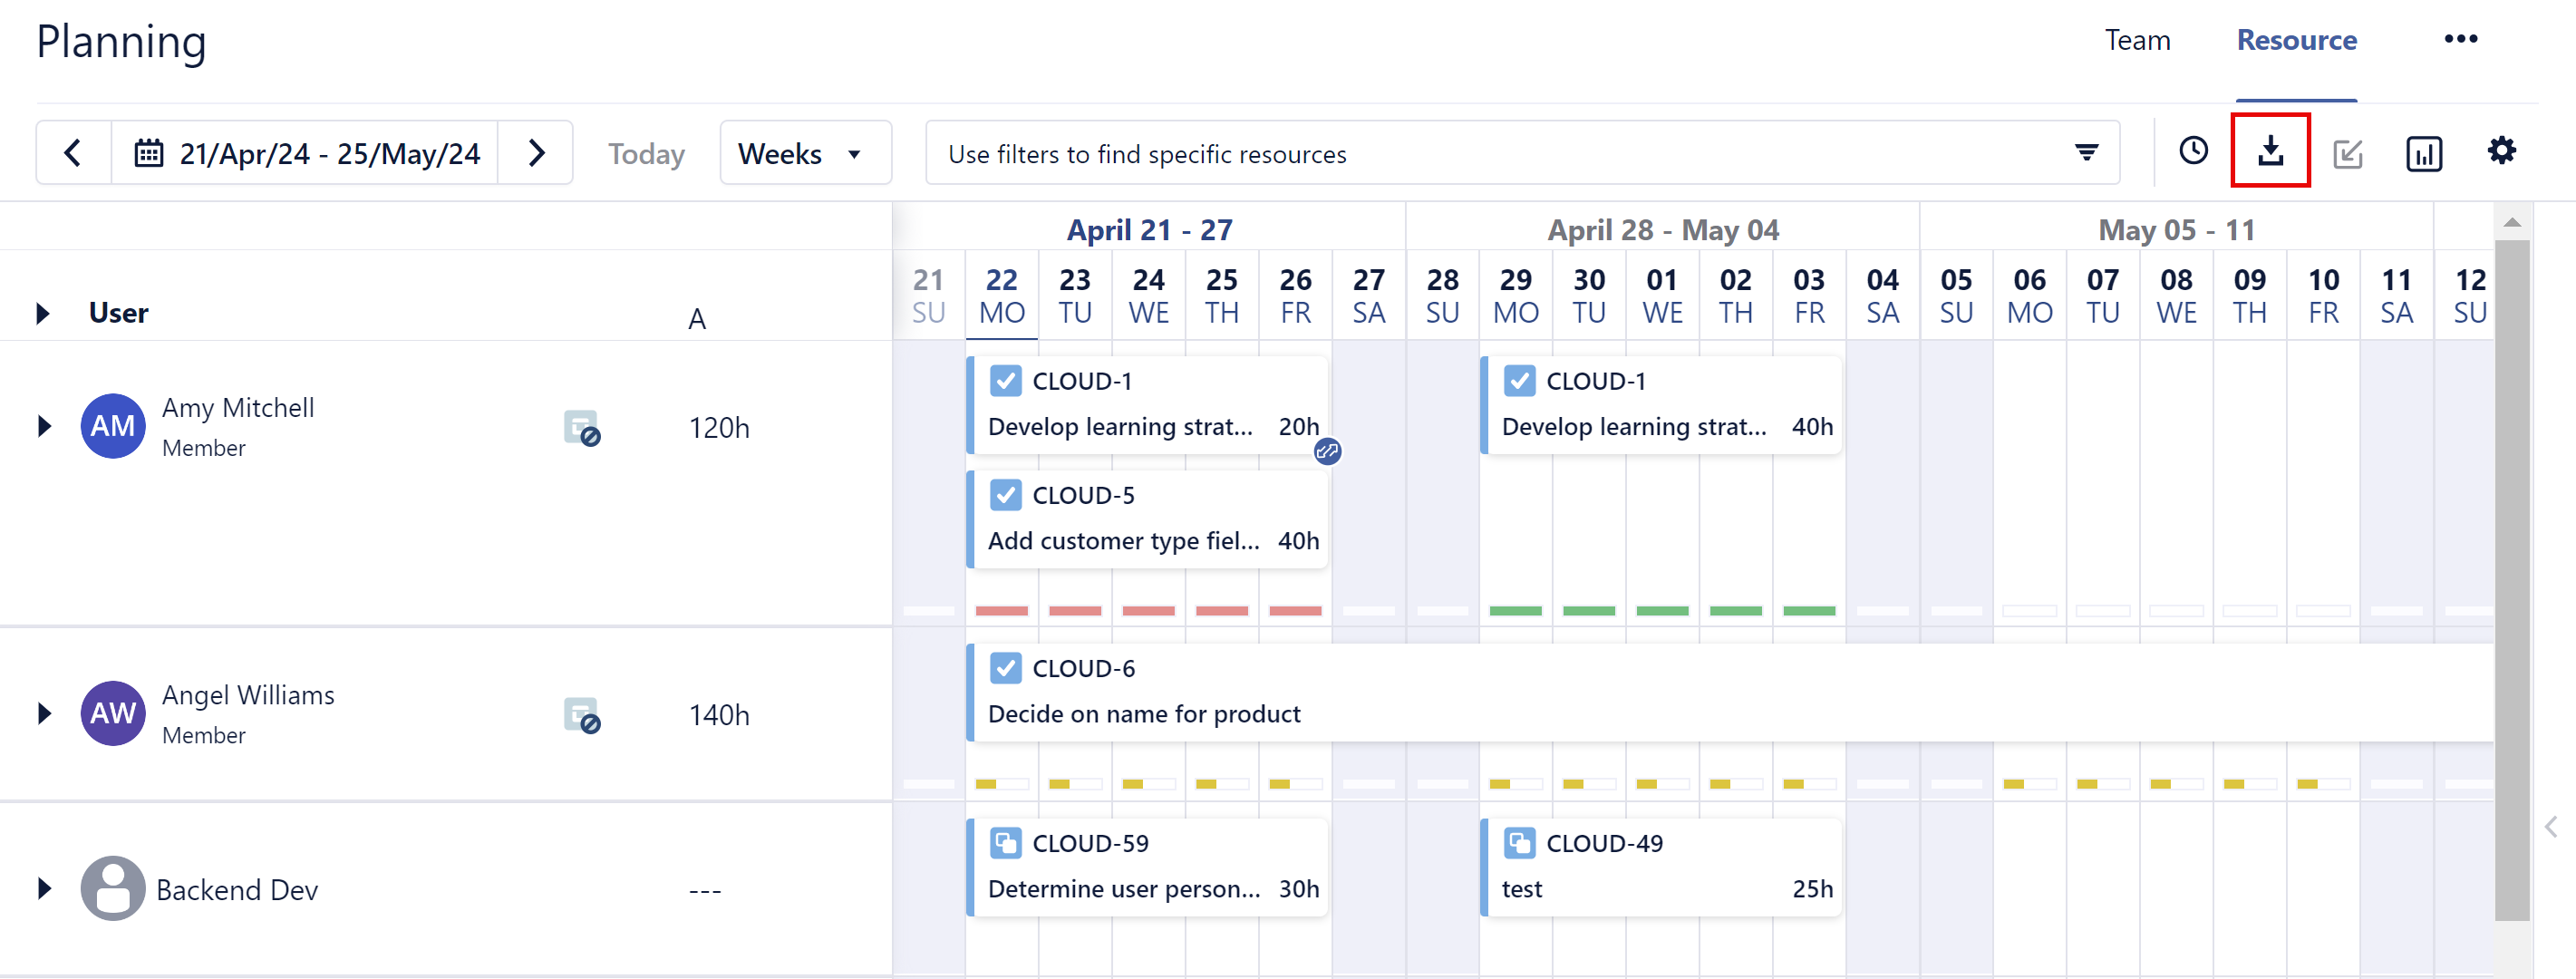
In the Resource Planning View, select a date range.
-
You can narrow down the Resource Planning list by adding the required filters. Click Filter by to select the filters by Teams, Users, Roles, Skills, or Generic Resources.
-
Click the Export Capacity Report button (shown in the above image) to export the data to a .CSV file for reporting.
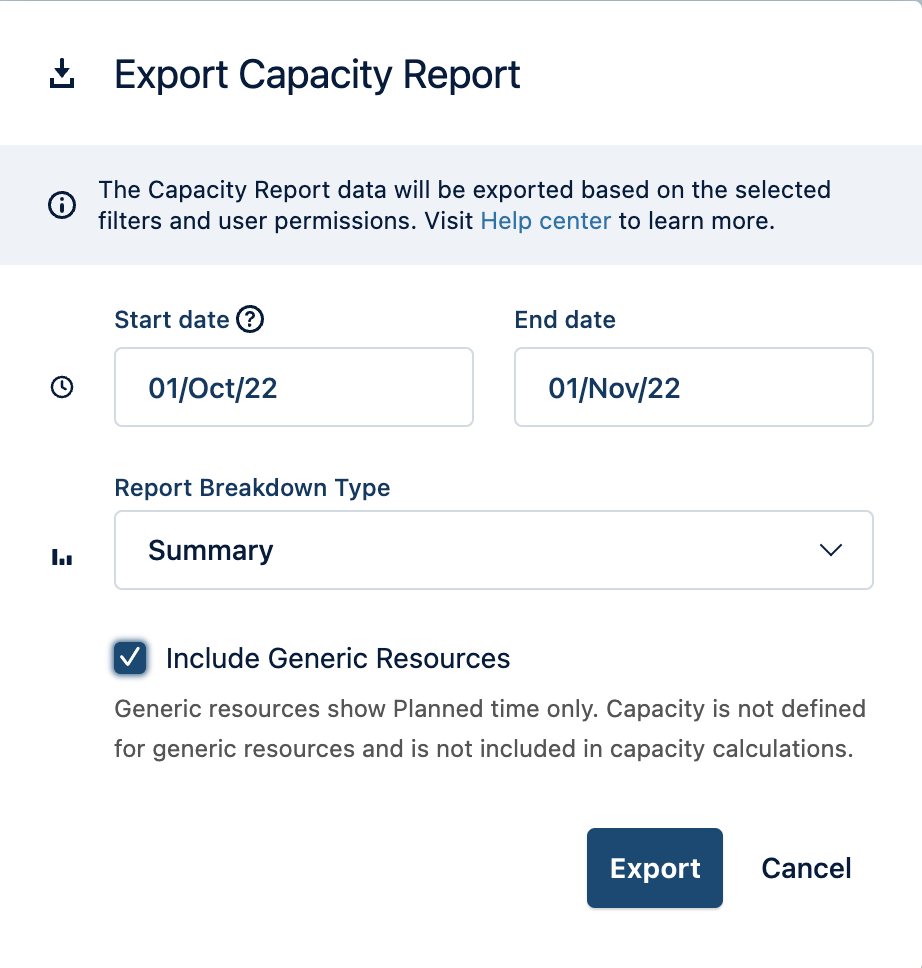
The Export Capacity Report window opens, allowing you to export the data based on the applied filters.
Only users for whom you have permissions to view plans will be included in the exported data.
-
Select a Start date. The current date is displayed by default.
The selected start date cannot be in the past. In order to export planned activities that took place in the past, refer to Planned Time report or Planned vs Actual report to be able to export old data.
-
Select an End date.
If the selected End date is further than 90 days into the future, the exported data will not include any calendar events beyond the 90-day period.
-
Select a Report Breakdown Type. The exported data can be based on a weekly, monthly, quarterly, or a summary breakdown.
-
Click to check Include Generic Resources in the exported data, if you wish to include planned time for generic resources in the capacity export.
Only planned time data is included in the export for generic resources.
Generic resources are not defined with capacity data. Capacity calculations require workload schemes, which are not available for generic resources.
-
Click Export.
The data is exported, and a file is sent to your Download folder.
-
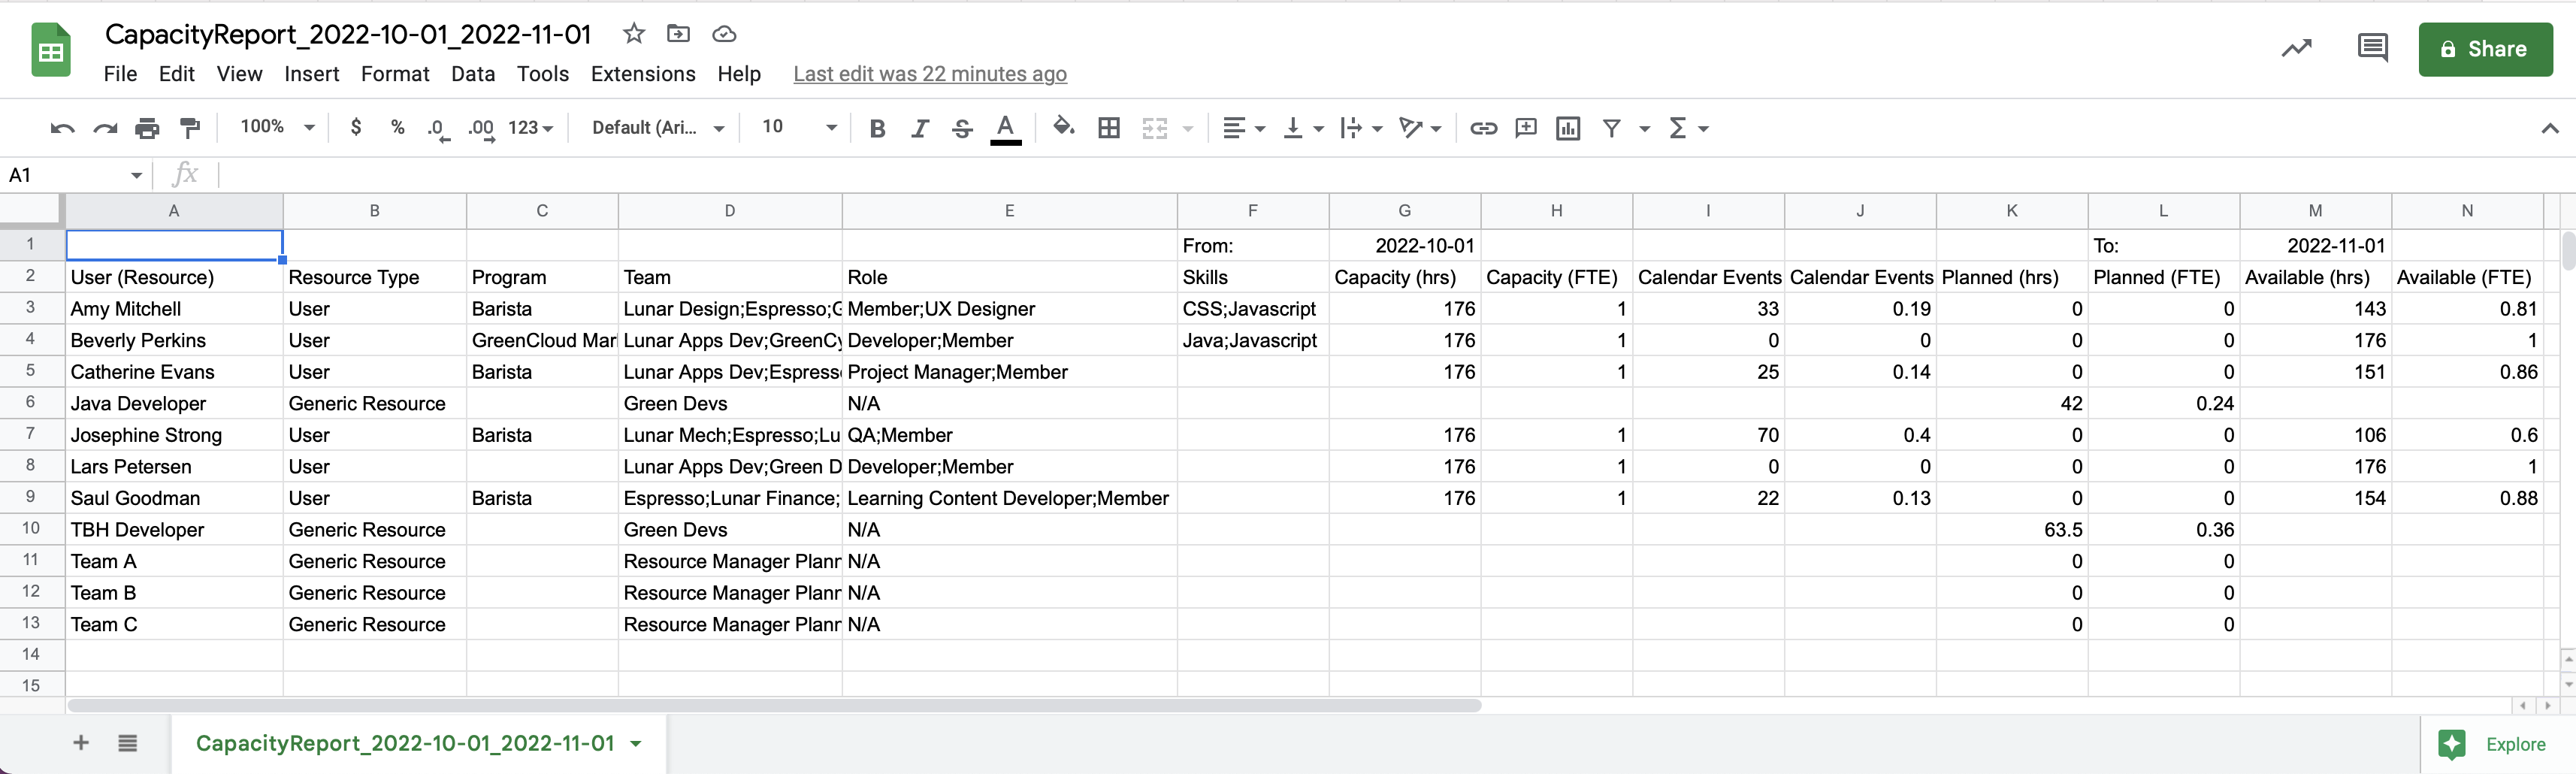
Click to open the downloaded file titled CapacityReport_<Start date>_<End date>.CSV, or manually open it in your preferred editor or spreadsheet.
All capacity values are displayed by Full Time Employee (FTE) and hours, for the selected export type that shows a breakdown by weekly, monthly, quarterly, or summary.
Group and Filter Capacity Data
The capacity data calculates the planned time versus the available time, in hours and in FTE values for each resource. Drill down into the capacity data by grouping and filtering your exported data to switch between units of measure. For example:
-
Group by Team
-
Filter per unit (FTE or hours)
-
Filter by roles
To group and filter your capacity data:
-
Open the exported capacity report file.
-
Scroll across the rows. Data is grouped by date range.
-
For large files, you can group or filter by Program, Role, or Team values to narrow the list and provide capacity and availability of resources per program, role, or team. For example, to group by Teams, first split the column into rows, then filter by the team name.
-
The capacity file includes the following columns:
|
Title |
Description |
|---|---|
|
From |
Start date of the capacity export. |
|
To |
End date of the capacity export. |
|
User (Resource) |
Name of the Resource. |
|
Resource Type |
The type of resource can be User or Generic Resource. |
|
Program |
The program name or the department name in a team of which the resource is a member. |
|
Team |
Name of the teams in which the resource is a member. If the resource is a member of multiple teams, the team names are separated by commas. |
|
Role |
The type of roles assigned to the resource. If the resource has multiple roles, the roles are separated by commas. |
|
Skills |
The skills that are assigned to the resource. If the resource has multiple skills, the skills are separated by commas. |
|
Capacity (hrs) |
Resource capacity in hours. |
|
Capacity (FTE) |
The capacity FTE value for each user is the ratio of their hours divided by the default required hours. If a person is in workload/holiday schemes required to work equal amounts, then they have a capacity (FTE) of 1. If they are required to work less, they have a capacity of less than 1; if they are required to work more, they have a capacity of greater than 1. For example: One Capacity (FTE) = 1 is the capacity of a person who is in your default workload scheme and your default holiday scheme. |
|
Calendar Events (hrs) |
Calendar events in hours. |
|
Calendar Events (FTE) |
The ratio of the hours in calendar events booked for a user versus the hours of 1 FTE. |
|
Planned (hrs) |
Planned hours. |
|
Planned (FTE) |
The ratio of the planned hours for a user versus the hours of 1 FTE. |
|
Available (hrs) |
Available hours are the result of the subtraction of Planned (hrs) and Calendar events (hrs) from the Capacity (hrs). |
|
Available (FTE) |
Available FTE is the result of the subtraction of Planned (FTE) and Calendar events (FTE) from the Capacity (FTE). |
-
To format your report, import this data into a template or a report generator in order to create a custom look.
Chart Capacity Data For Resource Planned Time and Availability
A data chart can provide a good representation of the exported capacity data.
-
Create an area chart, a line chart or a stackable chart in the worksheet based on the exported data.
-
Consult the guides of the spreadsheet application that you are using on how to set up data charts, and select the one best suited for your needs in order to analyze the exported capacity data.
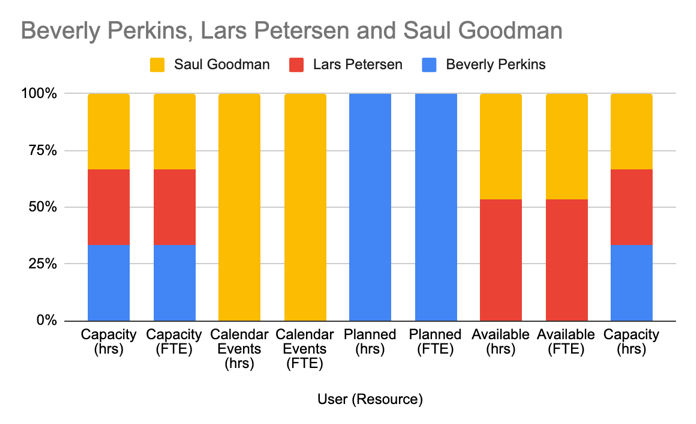
Here is an example of a bar chart based on the selected data in the CSV output file: