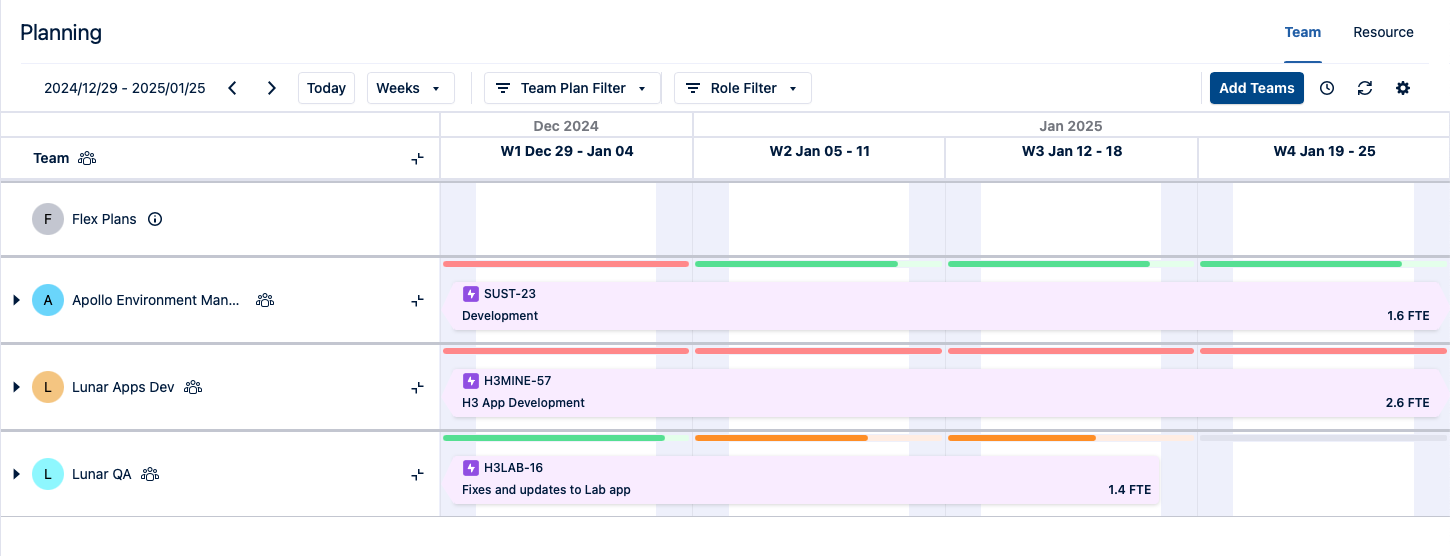
Capacity indicators provide a quick glance at the teams' capacity levels. They are visible in the Team Planning view to provide insights into the teams' capacity on a weekly, monthly, or quarterly breakdown. The capacity calculations are visualized and color-tagged in the Team Planning view to show capacity levels for over-capacity, under-capacity, or at-capacity, enabling resource managers to allocate work more efficiently across teams based on each team's capacity level within the selected time period.
To analyze the capacity data:
-
In Team Planning, select Add Teams to add the teams you want to view the plans for.
-
Select to view the team plans per month, week, or quarter from the dropdown list selection next to the Today button.
-
Scroll across the dates to select the time period you want to view or select the Today button for the current date.
-
You can filter the Team Planning view by the selected work item status in the Work Status Filter button:
-
To Do
-
In Progress
-
Done
-
-
In addition, you can filter the Team Planning view by team roles. Select the Role Filter and select one or multiple roles.
The capacity data is recalculated, and capacity indicators are updated based on the filtered roles. This helps users to get the capacity calculations for specific groups within the teams. For example, you can filter by the developer role to see the capacity of developers in the managed teams for the selected time period.
-
The capacity indicators bars are displayed above each week, month, or quarter to indicate the capacity level of the teams. Those are color-tagged as follows:
-
Red indicates over-capacity when 100% allocation or more is assigned.
-
Orange indicates under-capacity; between 0 and 80% allocation is assigned.
-
Green indicates at-capacity when allocation is between 80% and 100%.
-
Grey indicates no FTE or capacity calculations.
-
-
Select the expand icon to view or collapse the tasks for each team.
-
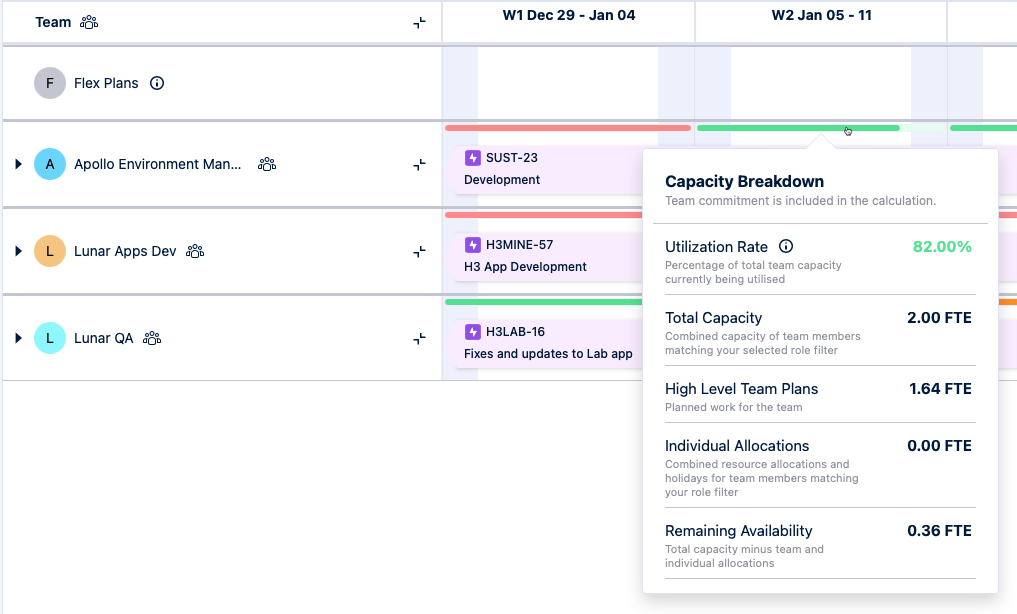
Select the capacity bar to view the breakdown of capacity, allocations, and availability for the selected timeframe and team.
-
Move to other timeframes to navigate the team's plans and capacity levels.