
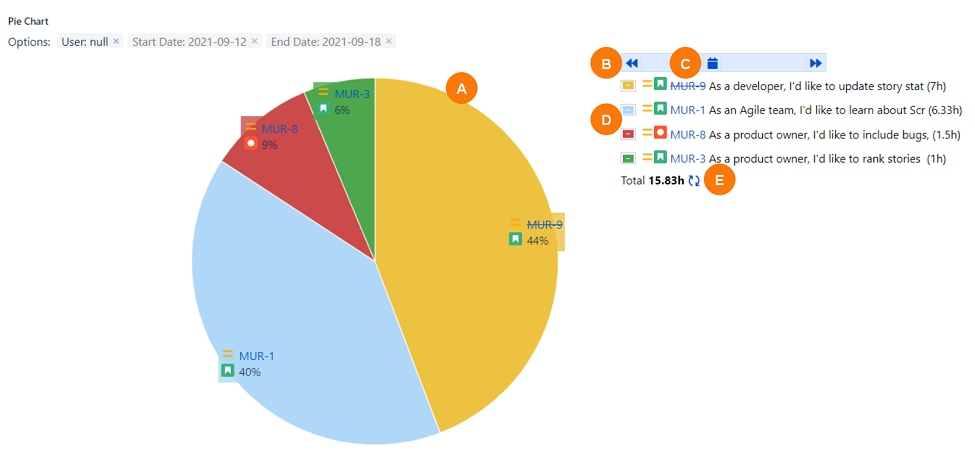
The Pie Chart report for Jira Server and Data Center displays a visual summary of worked time for a project in a certain period.
|
Element |
What is it? |
What can I do with it? |
|---|---|---|
|
A |
Pie Chart |
Displays the issues for the selected period. Wedges are sized according to the percentage of time worked. Click any issue number to access the full issue. |
|
B |
Previous and Next icons |
Click to scroll to the previous or next week. |
|
C |
Worked Hours icon |
Select whether to display the daily, weekly, or monthly worked hours. |
|
D |
Issue list |
Displays the list of issue for the time period selected. Click any issue number to access the full issue. |
|
E |
Total row |
Displays the total time spent for the issues in the time period selected. |