Integrating Capacity Planner and Gantt Charts for Structure allows you to plan work anywhere and visualize allocations across all of Jira:
-
Visualize and plan your project timeline in Gantt Charts
-
Visualize resource allocation and spot overallocation using individual or team data from Capacity Planner
-
Use Capacity Planner data to schedule work within your chart
-
Plan by teams or individual users
-
Include planned work from across the company when considering resource usage, even if that work isn’t part of your Gantt project
Enabling Planner Mode
To use scheduling and resource data from Capacity Planner:
-
Open Gantt Settings
-
Enable Planner mode
-
Select whether you want to schedule based individuals or Tempo Teams
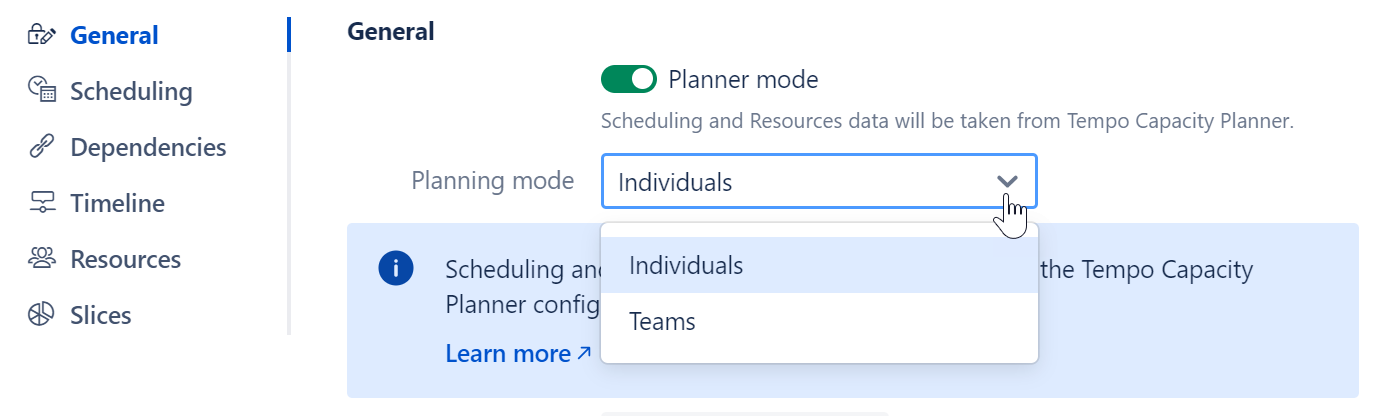
When Planner mode is enabled, many of the options on the Scheduling and Resources screen will be grayed out, as this information will be pulled from Capacity Planner instead.
In order to use Tempo data for resource availability, the Jira admin must first connect Structure and Capacity Planner.
If you receive a 'Jira feature is switched OFF on Capacity Planner side' message, ask your Jira Admin to go to Apps | Tempo | Settings | Planning Time and enable Sync plans with Jira work items. Once this is enabled, return to the Gantt configuration and select Use scheduling and resource data from Capacity Planner again.
Individuals vs. Team
When using Planner mode, you can visualize and schedule work based on individual users or Tempo Teams.
Individuals
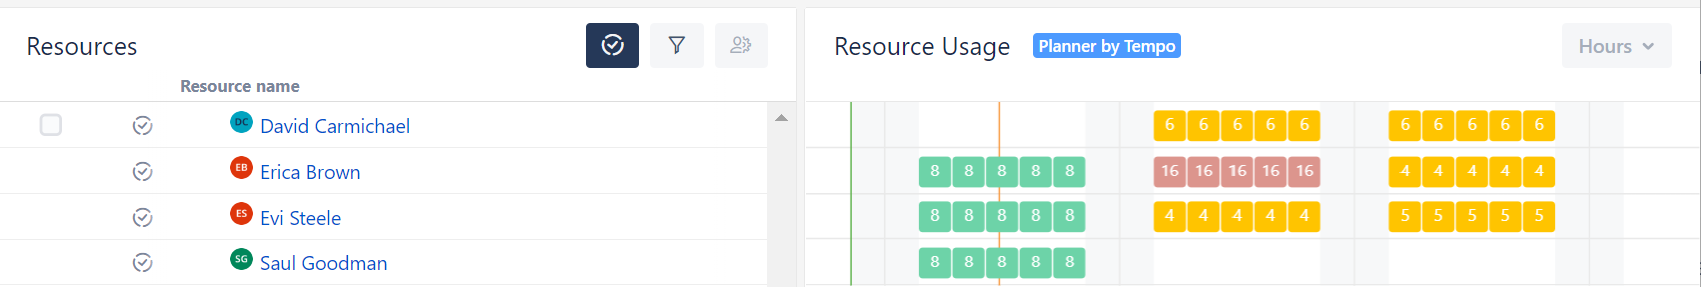
When planning for individuals:
-
The Resources panel displays all users that have work assigned to them in the structure
-
The Resource Usage panel displays different information, depending on whether you’re using Planner data or Gantt data:
-
Planner data (the Tempo icon is highlighted) - displays the total amount of work planned for individuals, across all projects, even for work items not in the chart
-
Gantt data - displays the total amount of work assigned to individuals within the Gantt chart
-
Teams
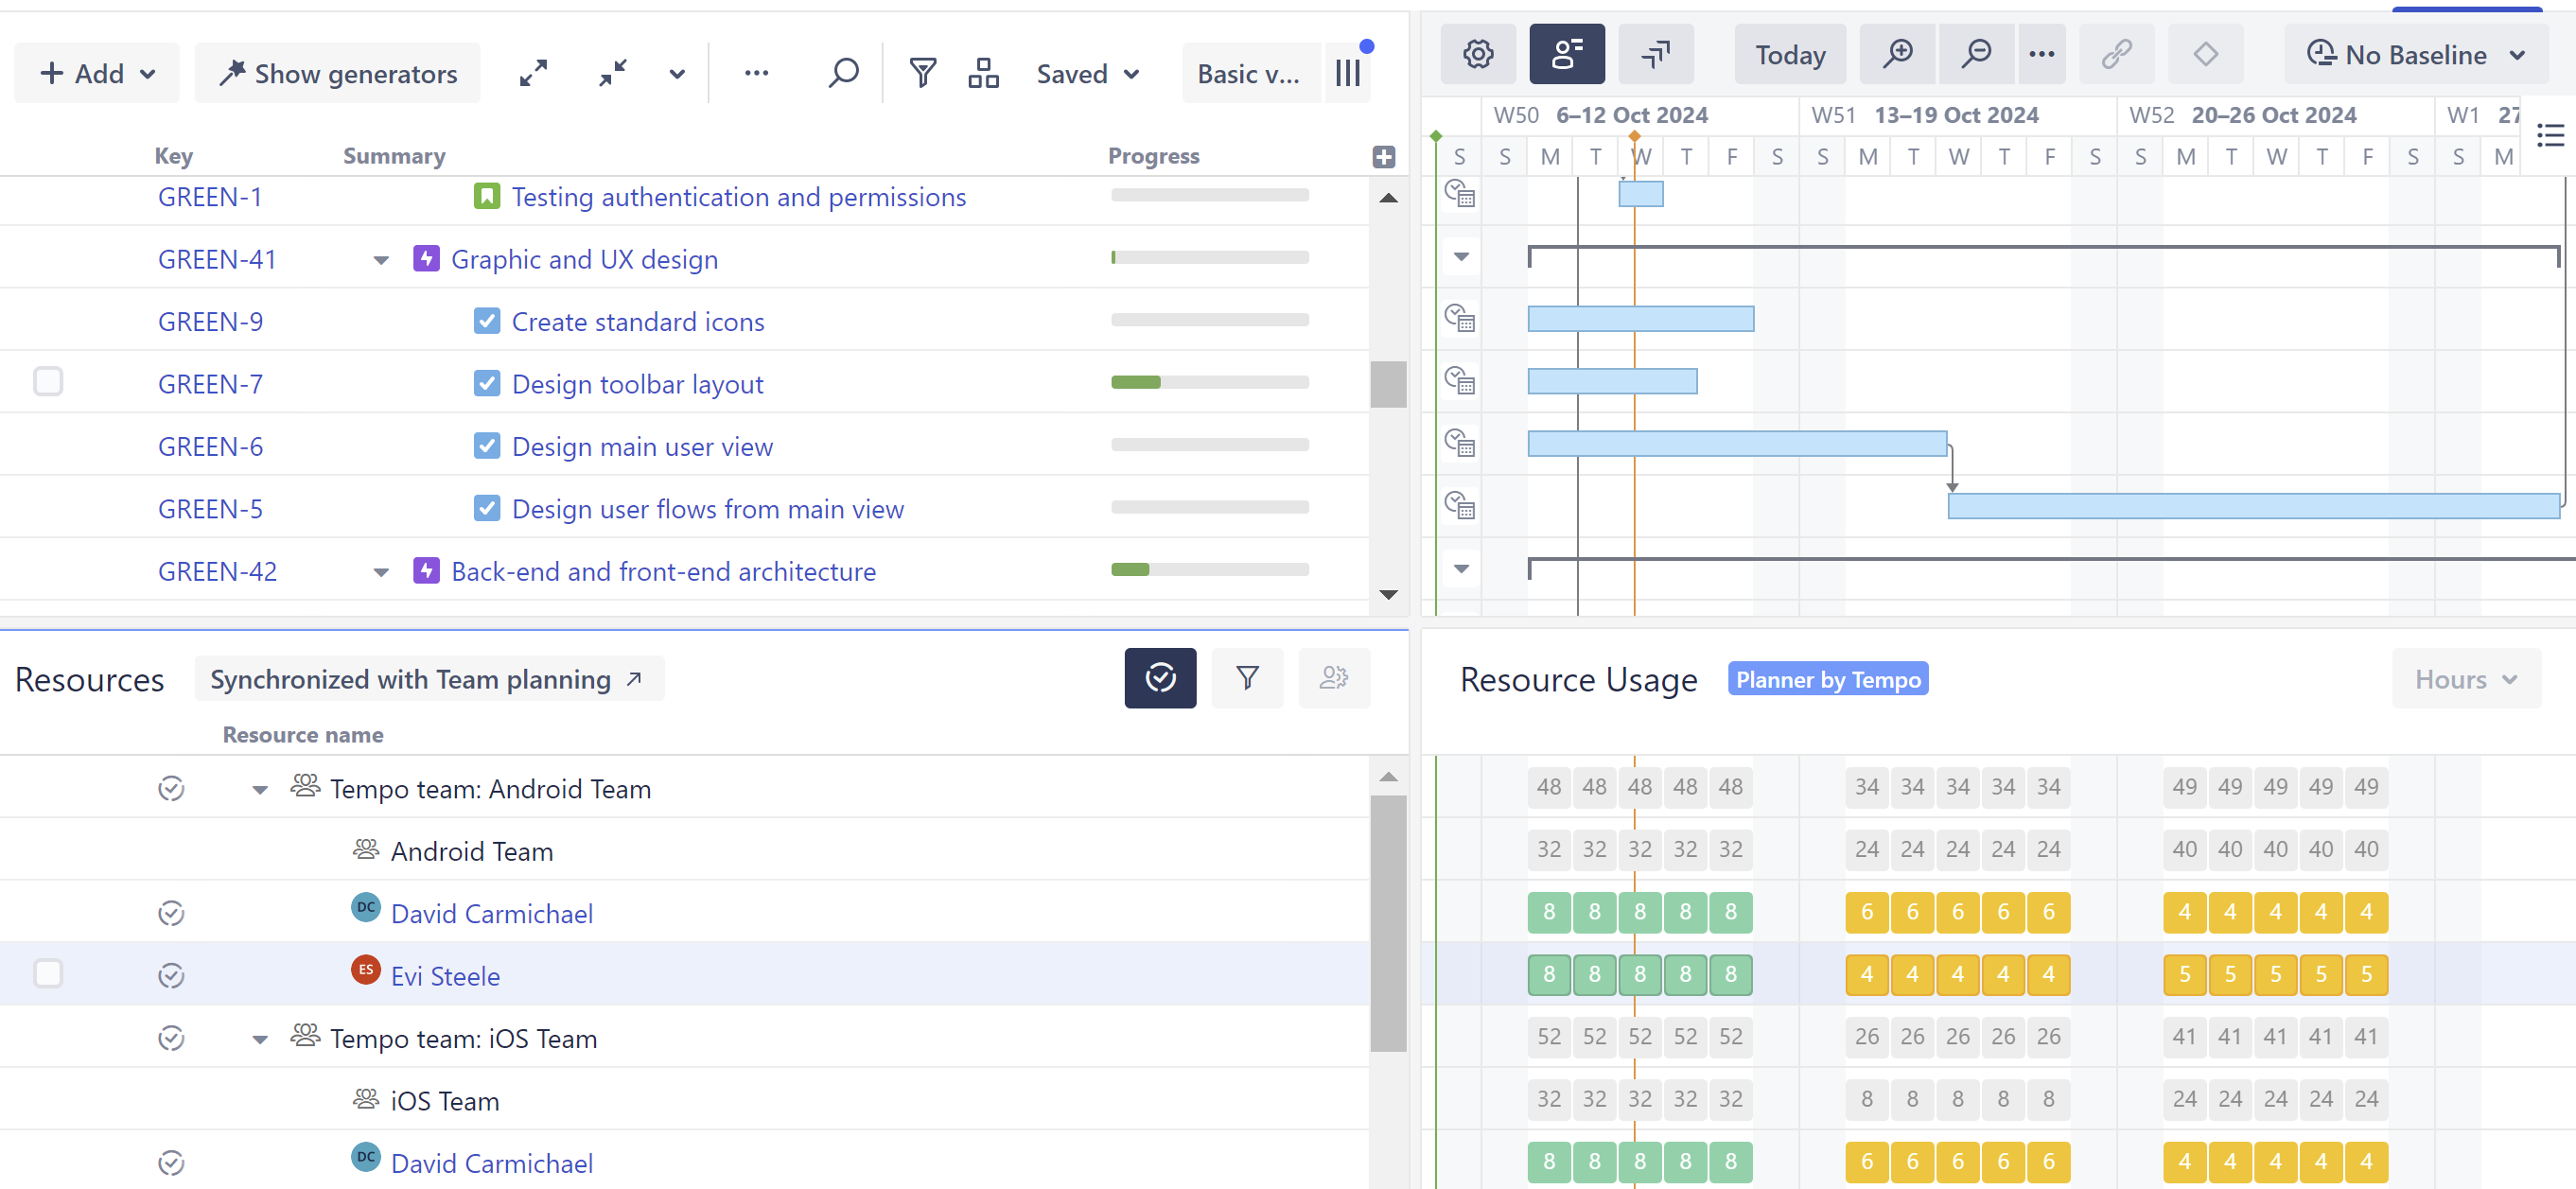
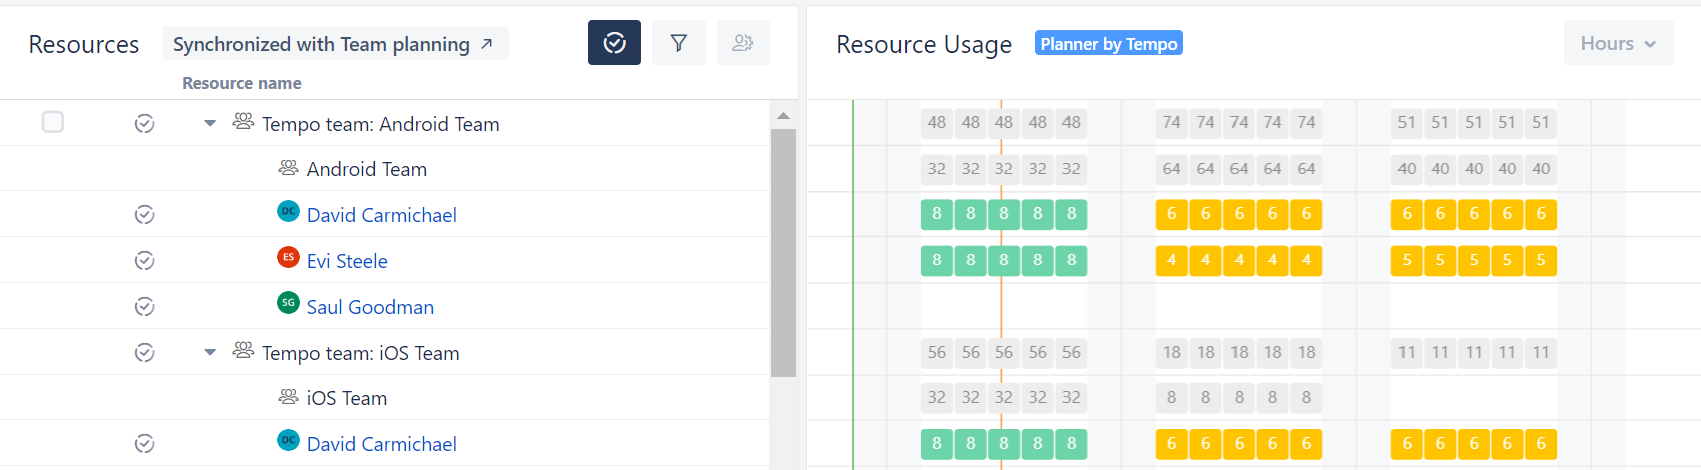
Team Planning mode allows you to visualize time for your teams, as well as each member within a team. When using Team Planning and Tempo data, the resource usage is rolled up. In the example below:
-
Team members (ex. “Evi Steele”) - displays individual allocations from Capacity Planner
-
Team (“Android Team”) - shows epic-level work allocated to the team in Capacity Planner
-
Overall group (“Temp Team: Android Team”) - shows the combined allocation for the team and its team members
Don’t see allocations in the Resource Usage panel?
-
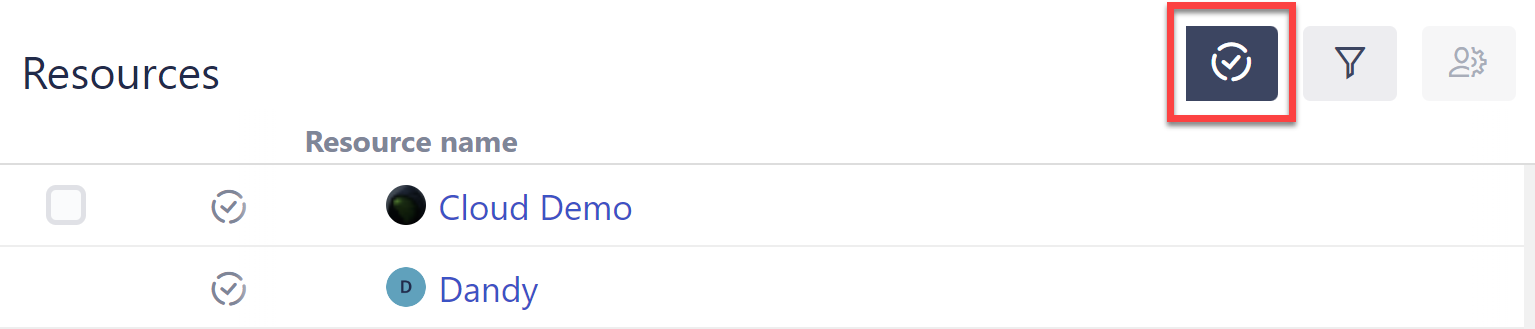
Click the Tempo icon
-
Make sure you have permission to view the plan data
If the structure is grouped by Tempo users or teams (either by a Group generator or quick group), the Gantt chart will not show Planner allocations for group items in the following places:
-
Dashboard gadget
-
Confluence macro
-
Exported Gantt chart
Gantt allocations will be displayed for the groups in these locations.
Scheduling and Resource Allocation with Capacity Planner
When Planner mode is enabled, tasks will be scheduled according to the information provided by Capacity Planner:
-
If a work item has a plan associated with it, Plan Start and Plan End dates will be used to schedule the task.
-
If there is no plan associated with the work item: the work item will be automatically scheduled.
-
To apply custom manual scheduling rules to select tasks, use a Slice.
If your structure is organized with stories under epics, make sure Treat parent work items as groups is switched off to view your Team plans.
Resource Usage: Gantt vs. Capacity Planner
By default, the Gantt chart only shows utilization within the scope of the chart – so any work planned for work items that aren't in your structure (and Gantt chart) won't be accounted for.
Using Capacity Planner data, Gantt can consider allocations from any work item – even if it isn't in the chart – when determining resource allocation. So if you're scheduling Project A, but someone on your team has work planned for Project B, that time will be considered when determining their availability.
Switching Between Capacity Planner and Gantt Data
In the Resource panel, you can toggle between using Capacity Planner data or the Gantt chart's data to calculate utilization by clicking the Tempo button.