Go to the Scheduling page of Gantt settings and scroll down to the Behavior section. From here you can toggle options to treat parent work items as groups, and to display nested items from a group in a single row.
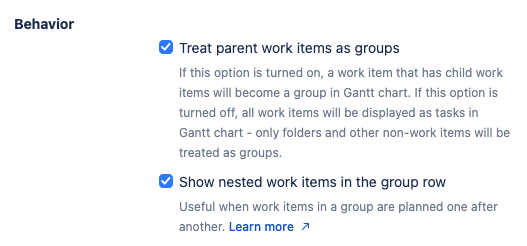
Treat parent work items as groups
If a work item is treated as a group, any resources assigned to that work item will be ignored when calculating resource usage.
A group aggregates values from the tasks it contains, and its own values for manual start date, finish date or work estimation are ignored. You can configure your Gantt chart to show parent work items either as actual tasks or as groups (containers for tasks).
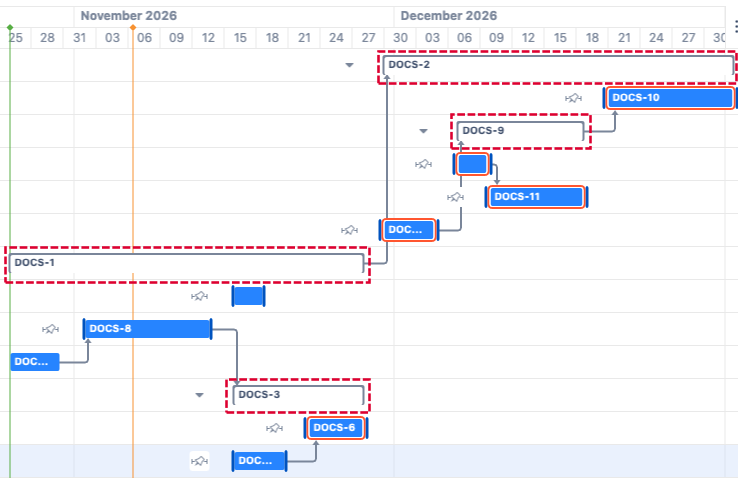
Gantt groups work items by default. To have your parent work items shown as actual tasks, on the Scheduling screen, under Groups, toggle Treat parent work items as groups.
Single row view
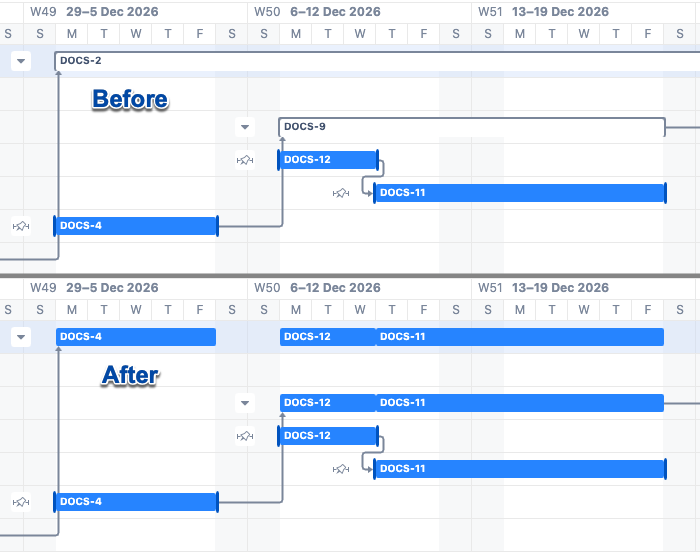
Make sure you enable Treat parent work items as groups first, then enable Show nested work items in the group row to show a linear view of nested items in the group parent’s row instead of displaying the parent as a single bar across its length. This can be useful to track your projects chronologically and view them in a way similar to a product’s roadmap.
This option does not change the appearance of your bars, including any configurations for slices.
Single row view does not support the creation of dependencies between the group row and its sub-items. Dependencies created before enabling the view will still display.
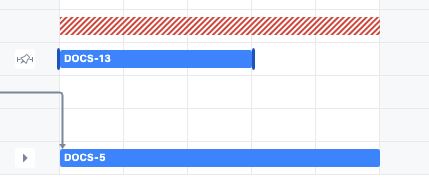
If the dates for items overlap, you will see red hash marks instead of a standard bar in the single group row. This marker covers the full duration of the longest task affected by the overlap. Items marked as milestones do not display this overlap.
In the following example, DOCS-13 only overlaps DOCS-5 by three days, but the overlap marker is blocked for the duration of DOCS-5.