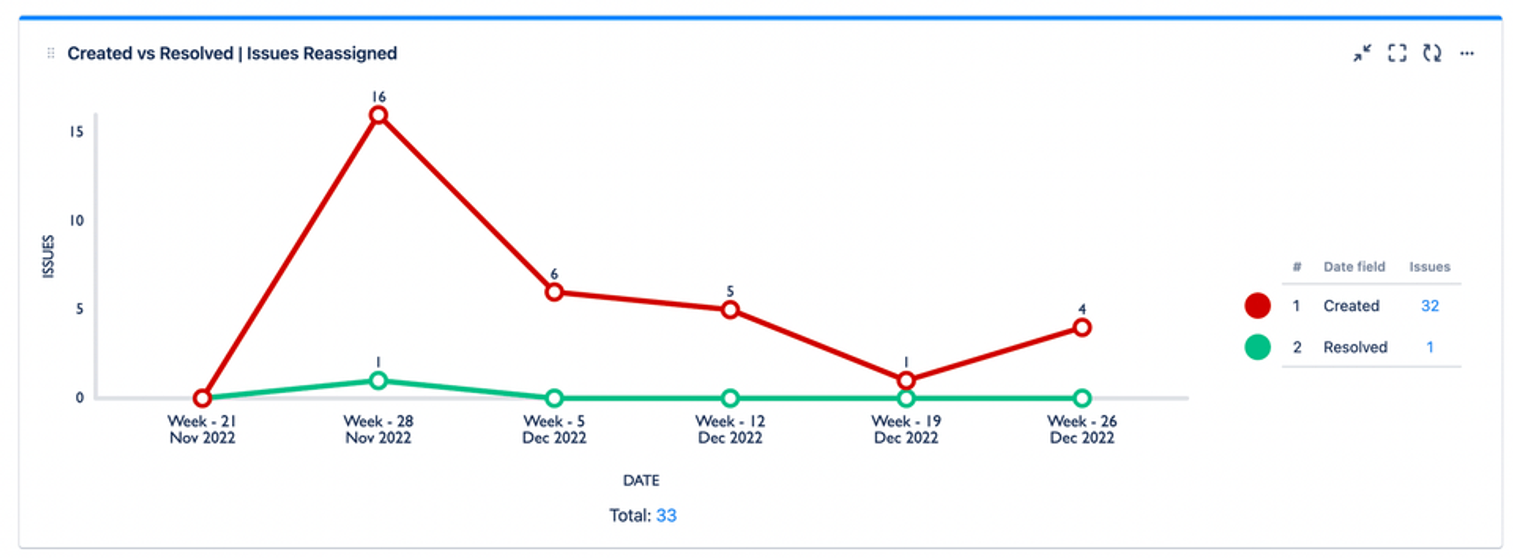
This 2D line chart shows the number of issues reassigned by Out of Office Assistant that have been Created vs. Resolved.
Recreate this Chart in Your Instance
-
Set the Source to Advanced (JQL) and enter the following JQL statement: assignee CHANGED BY "59fb203e1c0767667b2ce0ad
-
Set the Chart type to 2D Line Chart
-
Set the Chart by dropdown to Dates
-
Optional: Change your date ranges and timeframes, give your chart a title and combine or rename any segments
-
Click Save or Insert