Skip table of contents

Program Manager

Custom Reports

With Structure, you can easily create a visual overview of your projects – and visualize all the data you need to track on a single screen.

Step 1: Build Your Structure

To create a new structure:

  • Open the Structure Selector menu and select Create New Structure

  • Use the +Add menu to add work items and build your hierarchy:

    • Use Presets to use one of Structure's preconfigured hierarchies

    • Or configuring your own hierarchy using +Add | Insert | Basic Insert, +Add | Group, and +Add | Extend

Step 2: Add Data

Next, add the data you need to track by clicking the button at the top-right corner of the structure. You can add as many columns as you need, including:

  • Jira Fields - For each Jira field, Structure offers a column that displays that field's value.

  • Progress - Display an aggregate work item progress, which is calculated based on values from the work item and its sub-work items.

  • Totals  - Display aggregate values for work item progress, which include progress values from sub-work items.

  • Service Management - Jira Service Management customers can visualize and manage SLA fields within a structure.

  • Work Logged - View and manage Timesheets by Tempo work logged data alongside your project data.

  • Many more - To learn more about the available columns, see Adding Columns.

Once you've added your columns, you can aggregate the data up the structure. To do so, open the column you want to aggregate and select Sum over sub-items.

Looking to visualize your structure data as a chart or other report? Our integration with Custom Charts for Jira makes it easy to build customizable charts from your structure data. Learn more


Objectives and Key Results (OKRs)

Create a structure to organize and track Objectives and Key Results across all your Jira projects.

https://www.loom.com/share/2213e5910bf34d358b4f284a39be086c

Step 1: Build an OKR Project in Jira

We recommend adding 2 work types to your project:

  1. Objectives - the Parent items

  2. Key Results - the Child items

Step 2: Add Objectives to the Structure

  1. Create a new structure using Power mode

  2. In the new structure, go to + Add | Insert | Basic Insert

  3. Configure the following:

    • Project: <Select your OKR project>

    • Work Type: Objective

  4. Click Create

Step 3: Add Key Results

  1. Go to + Add | Extend | Child Work Items

  2. Configure the following:

    • Check the Work Items under epics box

    • Check the Moving an item in the structure will change its parent work item in Jira box

    • Extend levels: 1 to 5

  3. Click Create

Step 4: Add Epics

  1. Go to + Add | Extend | Linked Items

  2. Configure the following:

    • Link type: Add the link type you use to connect your epics to key results (we used Implements, but you may prefer another link, such as Relates to, etc.)

    • Check the Moving items in the structure will update links box

    • Extend levels: 2 to 2

You don’t have to use Epics for these - add whatever type of work item your team uses to track key results (tasks, stories, etc.).

Once you add your epics, you should see any child stories/tasks automatically added beneath them - this is because of the Extend Child Work Items generator we added in Step 3.

Step 5: Link Epics to Key Results

If you’ve already linked epics to key results in Jira, you should see those in the hierarchy. If not, or if you want to add more, here’s an easy way to link epics to key results:

  1. Create a structure that contains the epics you want to link to your key results (or use one you already have!)

  2. Select Split in the Structure toolbar to open a second structure panel

    • In the left panel, open the OKR structure

    • In the right panel, open the structure with your epics

  3. Drag epics from the right panel under the appropriate Key Result in the left panel - this will automatically add links between your key results and epics (if it doesn’t, open your Extend Linked Items generator and make sure the Moving items in the structure will update links box is checked)

 If an epic affects more than one key result, you can place it under as many key results as necessary and have its data reflected for all of them!

Step 6: Add Data

Next, add the data you need to track by clicking the button at the top-right corner of the structure. You can add as many columns as you need, including:

  • Jira Fields - For each Jira field, Structure offers a column that displays that field's value.

  • Progress - Display an aggregate work item progress, which is calculated based on values from the work item and its sub-work items.

  • Totals  - Display aggregate values for work item progress, which include progress values from sub-work items.

  • Service Management - Jira Service Management customers can visualize and manage SLA fields within a structure.

  • Work Logged - View and manage Timesheets by Tempo work logged data alongside your project data.

  • Many more - To learn more about the available columns, see Adding Columns.

Once you've added your columns, you can aggregate the data up the structure. To do so, open the column you want to aggregate and select Sum over sub-items.

SAFe Planning

Everyone uses the Scaled Agile Framework (SAFe) a bit differently, but Structure is highly customizable and easy to tailor to your specific SAFe needs.

Step 1: Build a SAFe Structure

To create a structure for SAFe: 

  1. Go to the Jira menu and select Structure | Create Structure
  2. Add initiatives: Automation | Insert | JQL Query | enter the appropriate JQL, such as "Project = 'project name' AND issuetype = initiative"
  3. Add epics below initiatives: Automation | Extend | Linked Issues | choose the type and direction used to assign Epics to Initiatives, such as "Implements" or "parent is Implemented by sub-issue"
  4. Add issues belonging to epics: Automation | Extend | Stories under Epics
  5. Add sub-tasks: Automation | Extend | Sub-tasks
  6. Sort by rank: Automation | Sort | type "Rank"
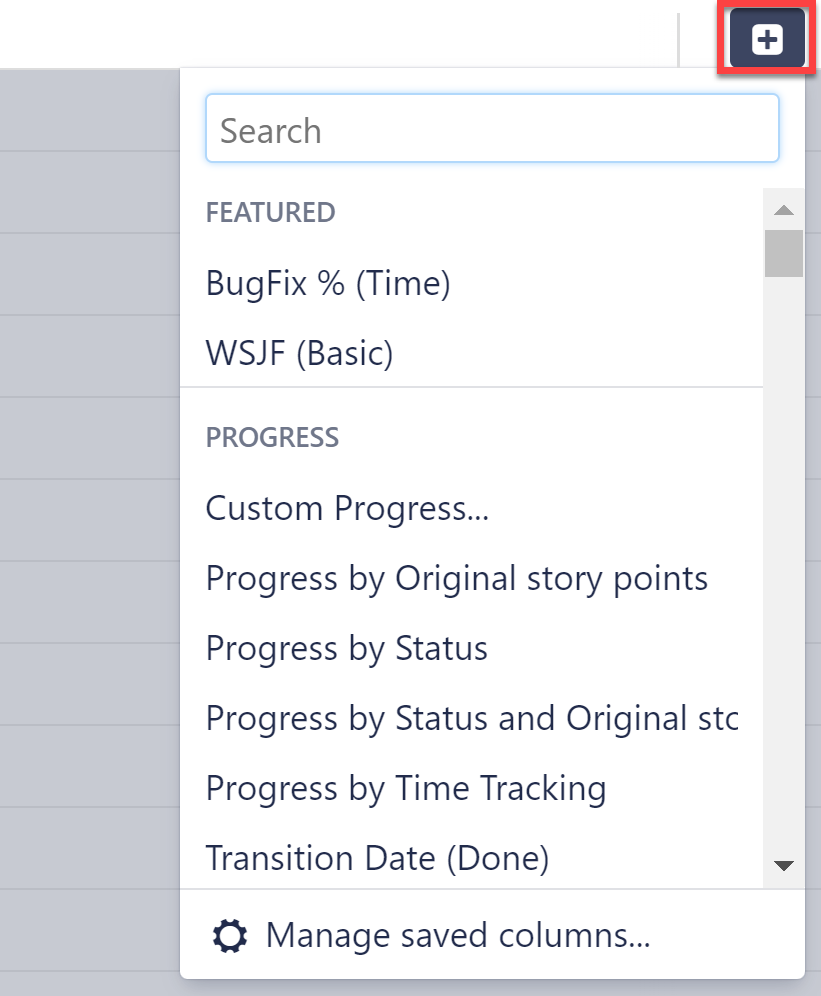
Step 2: Add Data

Next, add the data you need to track by clicking the button at the top-right corner of the structure. You can add as many columns as you need, including:

  • Jira fields, such as status, assignee, sprint, or remaining estimate
  • Progress - track status based on issue progress, percent completion, or resolution
  • Tempo Work Logged - track how long your team is spending on each issue
  • Formulas - create your own formulas to compare fields or create a visual report
  • Time in Status - see how much time issues spend in a particular status

  • Last Comment - view the latest comment for each issue

Once you've added your columns, you can aggregate the data up the structure. To do so, open the column you want to aggregate and select Sum over sub-items.

Take SAFe management to the next level

By adding Structure.Pages, you can manage your Strategy documentation and linked issues all in one place.

Learn More

Strategic Portfolio Management

Tempo's Strategic Portfolio Management solution is a modular approach to help organizations focus their priorities, people, and spend across their portfolio of products and services.

  1. Plan and manage your work in Structure.

  2. Convert your plans into boardroom-ready roadmaps in Strategic Roadmaps.

  3. Monitor the financial health of your portfolio using Financial Manager and Structure.

  4. Manage resources and resource allocation with Capacity Planner and Gantt Charts for Structure.

  5. Build custom reports to monitor your portfolio with Custom Charts.

The following products are part of Tempo's Strategic Portfolio Management solution. Pick the ones that are right for your teams, or try them all - you can download free trials using the links below.

Strategic Portfolio Management with Tempo Apps

JavaScript errors detected

Please note, these errors can depend on your browser setup.

If this problem persists, please contact our support.