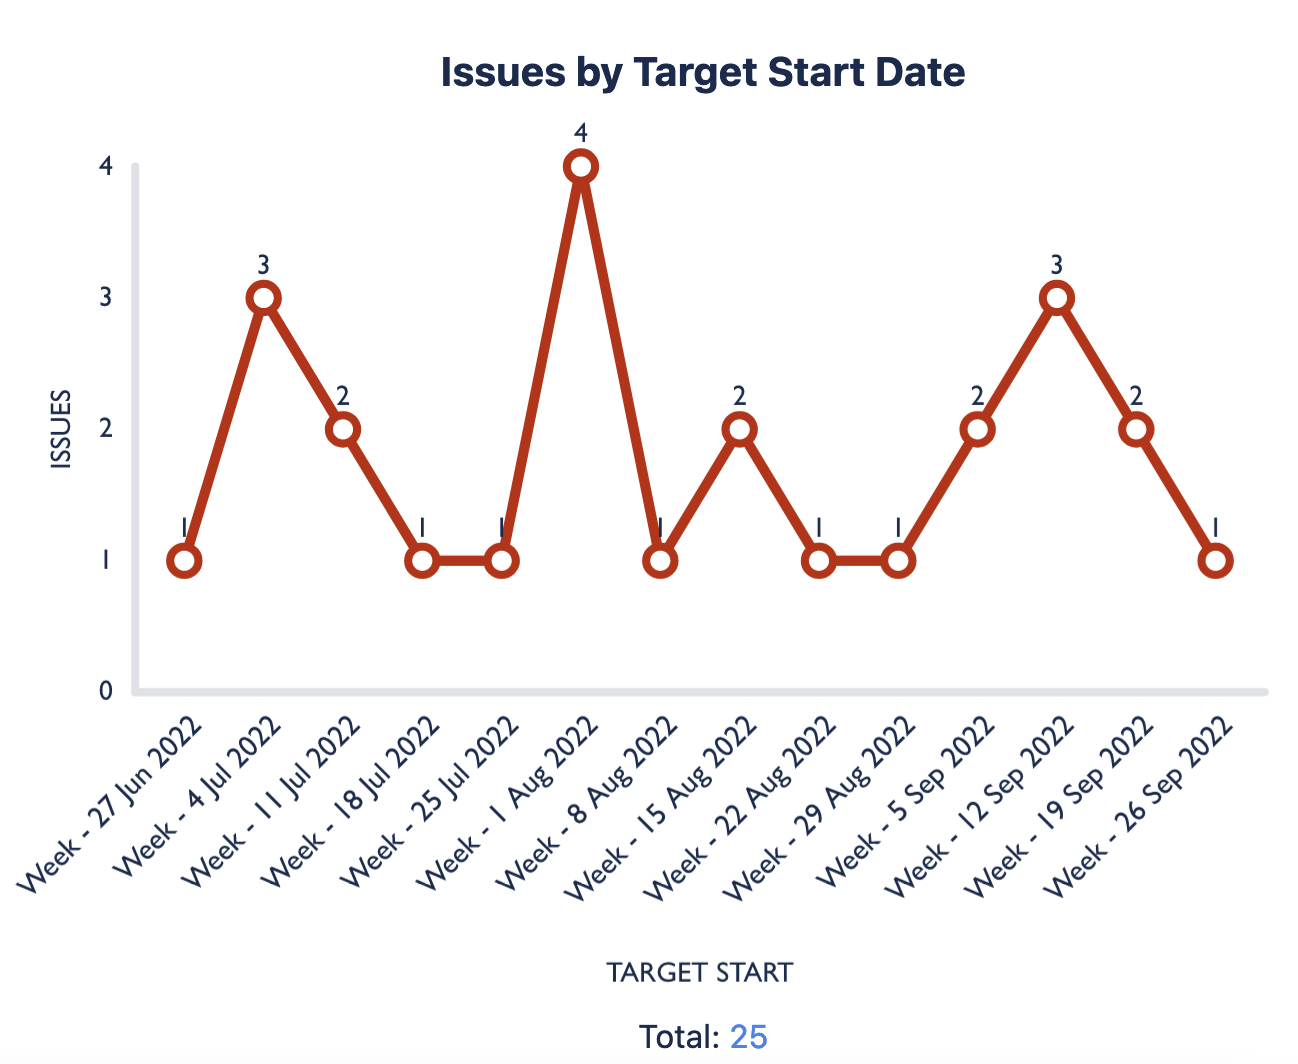
This chart shows the amount of issues in a project broken down by the Plans field “Target start”. This chart helps the organization the issues teams intend to start in the next quarter.
Recreate this Chart in Your Instance
-
Set the Source to Project(s) and select the Jira projects you’d like to pull in issues from
-
Set the Chart type to 1D Line Chart
-
Set the Chart by dropdown to Target start
-
Optional: Give your chart a title and combine or rename any segments
-
Click Save or Insert