Release Management
With Structure, you can track all the work items for upcoming releases – even if they're from different spaces – and visualize all the data you need to track on a single screen.
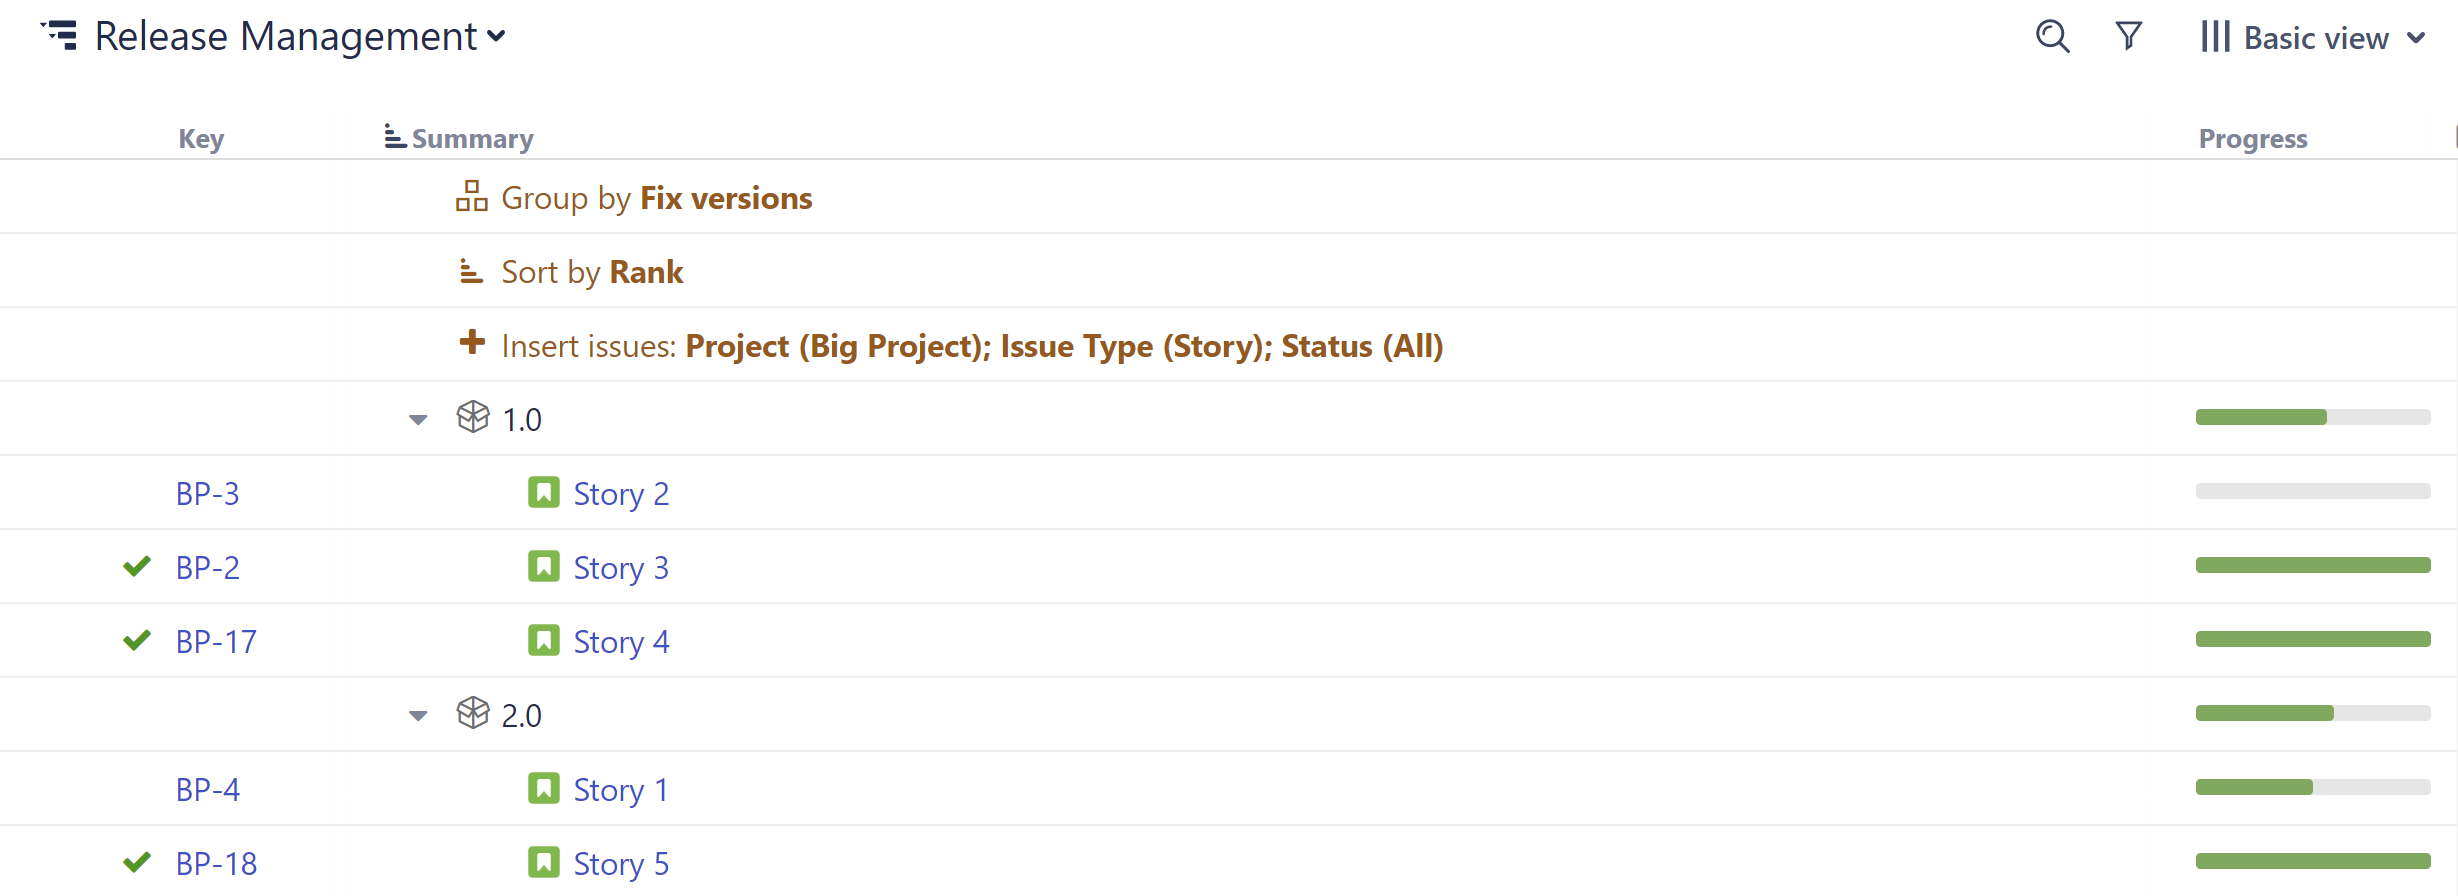
Step 1: Build a Release Management Structure
To create a structure for release management:
-
Open the Structure Selector menu and select Create New Structure
-
Add the work items you want to track – you can add them manually or automatically using +Add | Insert | Basic Insert
-
Group work items by fix version: +Add | Group | Field | select "Fix Version/s"
Want to include epics and stories?
-
When inserting work items, add epics: +Add | Insert | Basic Insert | open the Issue Types dropdown and select Epic
-
Add your stories: +Add | Insert | Child Work Items | under Add, select Work Items under epics and (optional) Sub-tasks.
Step 2: Add Data
Next, add the data you need to track by clicking the + button at the top-right corner of the structure. You can add as many columns as you need, including:
-
Jira Fields - For each Jira field, Structure offers a column that displays that field's value.
-
Progress - Display an aggregate work item progress, which is calculated based on values from the work item and its sub-work items.
-
Totals - Display aggregate values for work item progress, which include progress values from sub-work items.
-
Service Management - Jira Service Management customers can visualize and manage SLA fields within a structure.
-
Work Logged - View and manage Timesheets by Tempo work logged data alongside your project data.
-
Many more - To learn more about the available columns, see Adding Columns.
Once you've added your columns, you can aggregate the data up the structure. To do so, open the column you want to aggregate and select Sum over sub-items.
Looking to manage resources for your next project? Planner makes it easy to plan resources and capacity for your team.
Resource Allocation
When team members are working on multiple projects, it can be difficult to track how much work everyone is doing. Using Structure, you can track allocation across projects and reassign work on the fly.
Step 1: Build a Resource Allocation Structure
Insert work items from every space/board the team members work on, and then group them by Progress and Assignee.
To create a new structure:
-
Open the Structure Selector menu and select Create New Structure
-
Add all the work items: +Add | Insert | Basic Insert
-
Group work items by Status: +Add | Group | FIeld | select "Status"
-
Group work items by Assignee: +Add | Group | Field | select "Assignee"
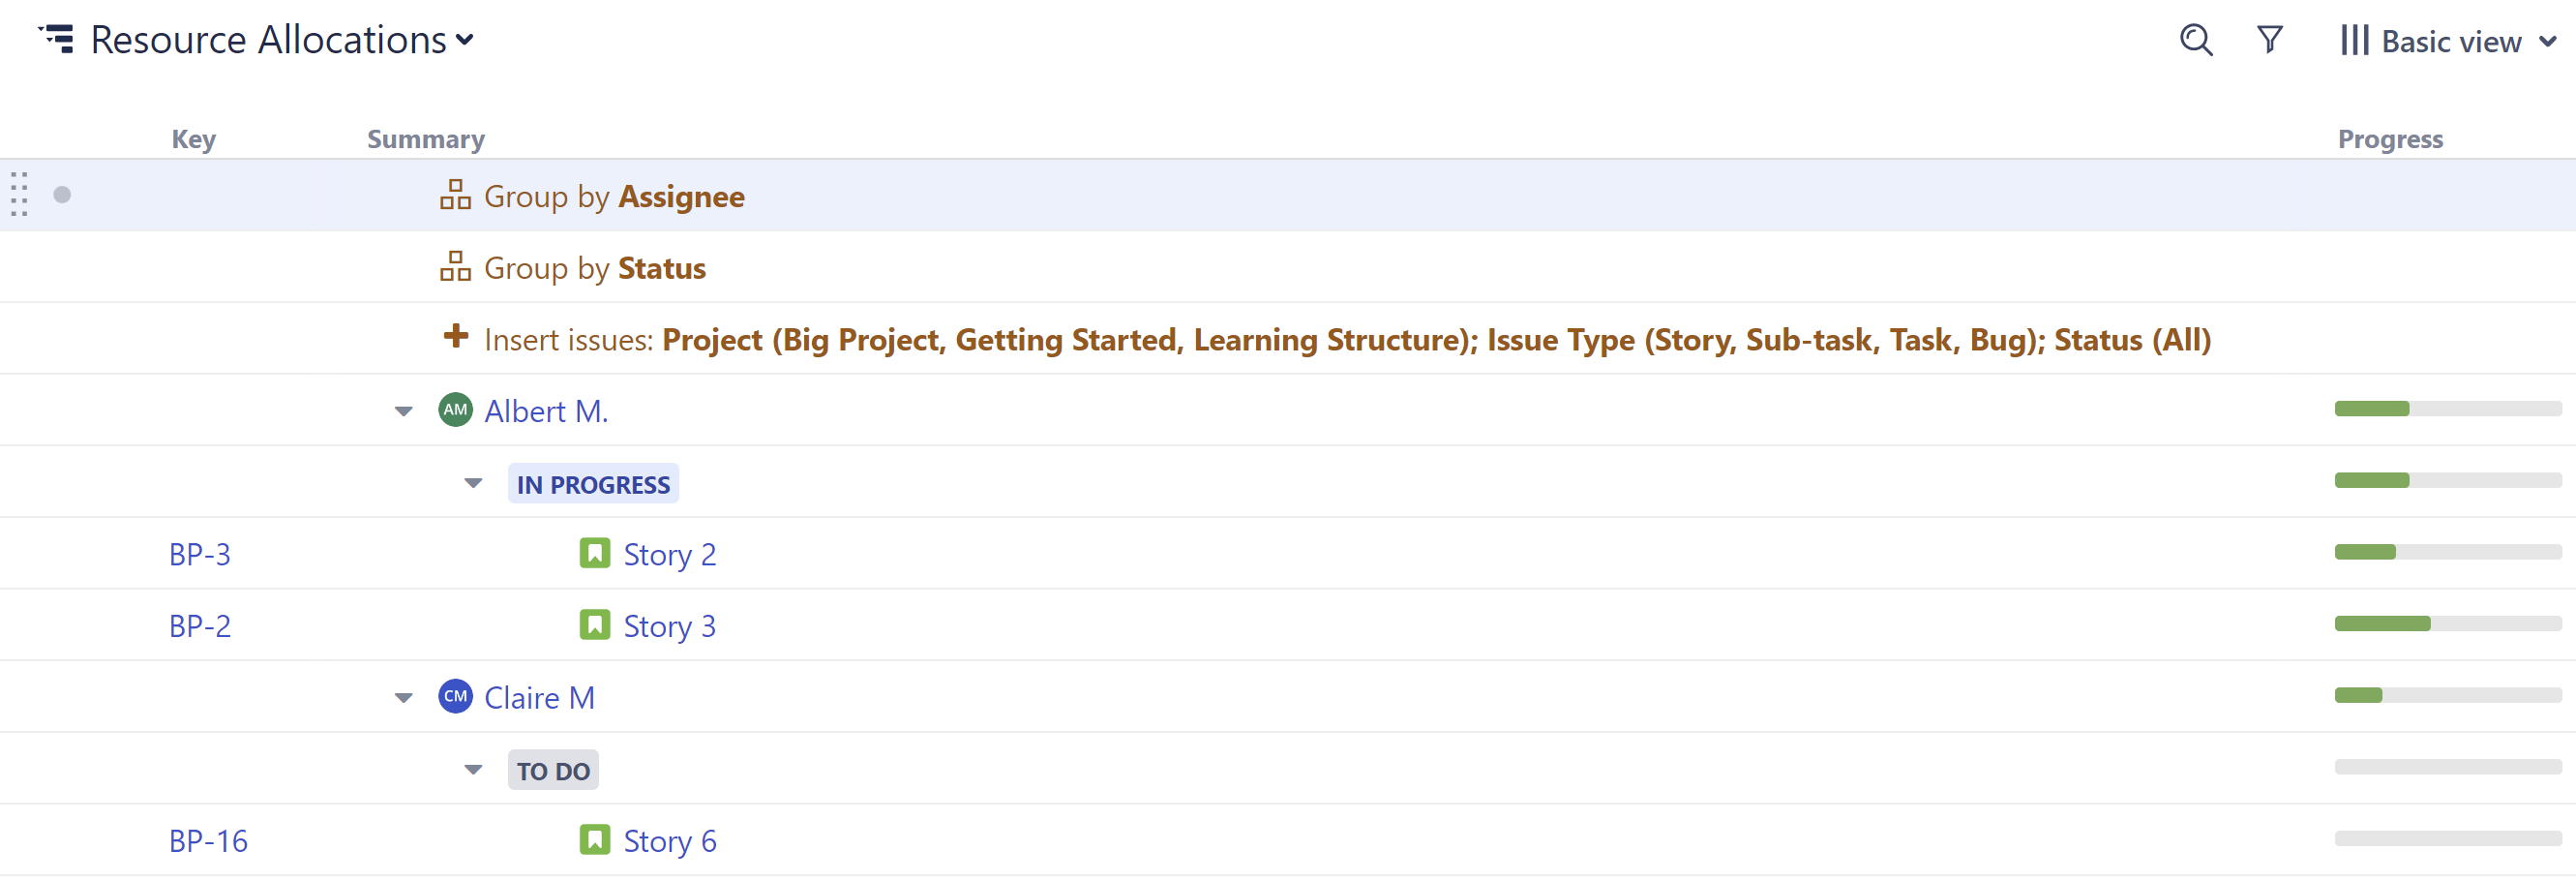
If the status is appearing above the assignee, drag the "Group by Status" row under the "Group by Assignee" row.
This will create a grouping for every team member with at least one work item in the current structure assigned to them. If someone doesn't have any work items assigned to them, they won't appear here. To fix this, simply assign an unassigned work item to that team member, and a new grouping will appear.
Step 2: Add Columns to Compare Workloads
Structure columns allow you to visualize multiple data points in a single view. We recommend one or more of these:
-
Status
-
∑ Story Points (if you’re using them)
-
∑ Original Estimate
-
∑ Remaining Estimate
-
A custom formula to calculate the remaining effort
Using a Totals columns, the values for individual work items are aggregated up to their assignee, so you can evaluate workloads at a glance. 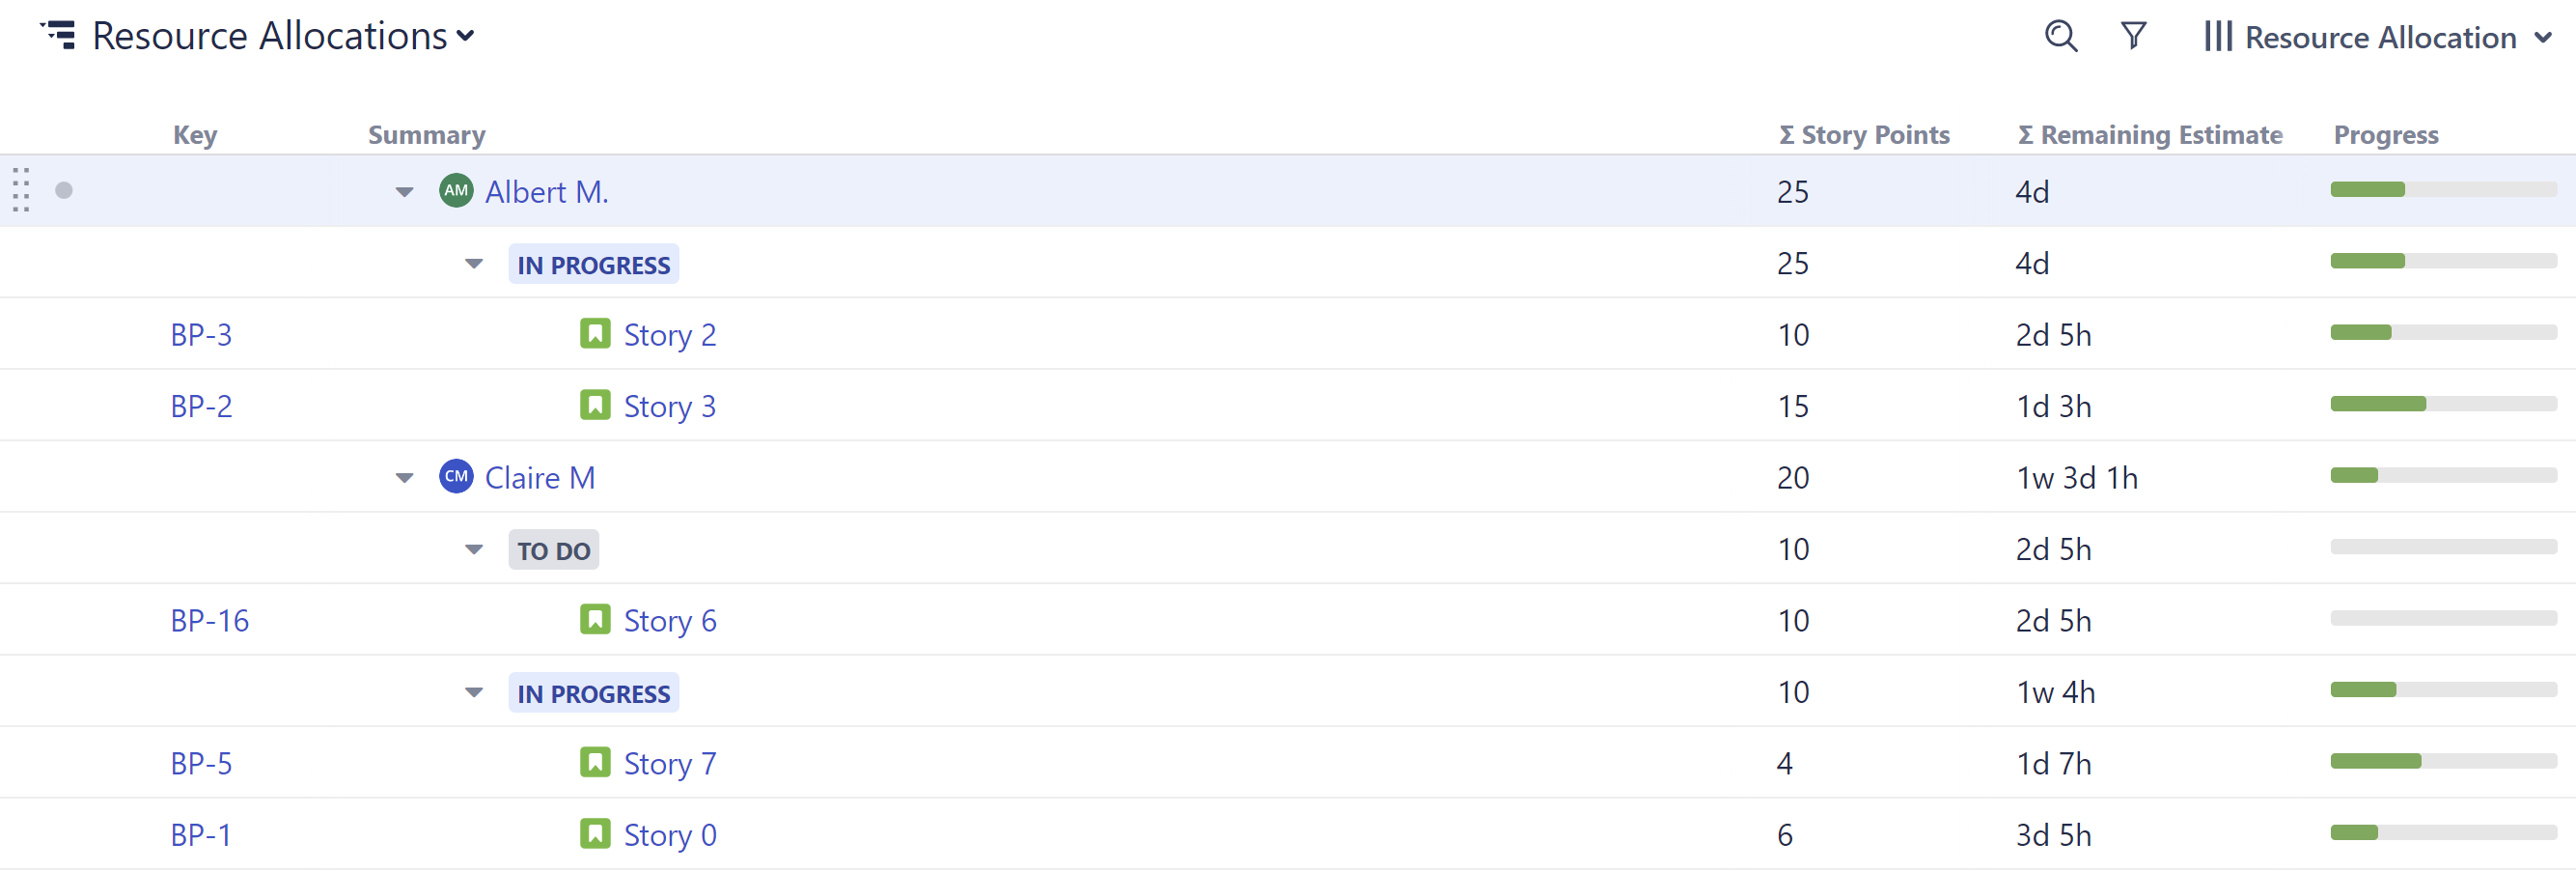
Step 3: Drag Work Items to Reassign
To assign/reassign tasks, simply drag work items from one assignee grouping to another.
Optional Enhancements:
-
To allocate resources at the group level, group work items by a custom Team field instead of Assignee.
-
Add a WSJF column to prioritize work items, and select Sum over sub-items to balance priorities across resources.
-
Manage allocation across sprints by adding a Group by Sprint generator. (Haven't assigned sprints yet? Check out Sprint Planning with Structure!)
-
Try Planner by Tempo to plan resources and capacity for your team.
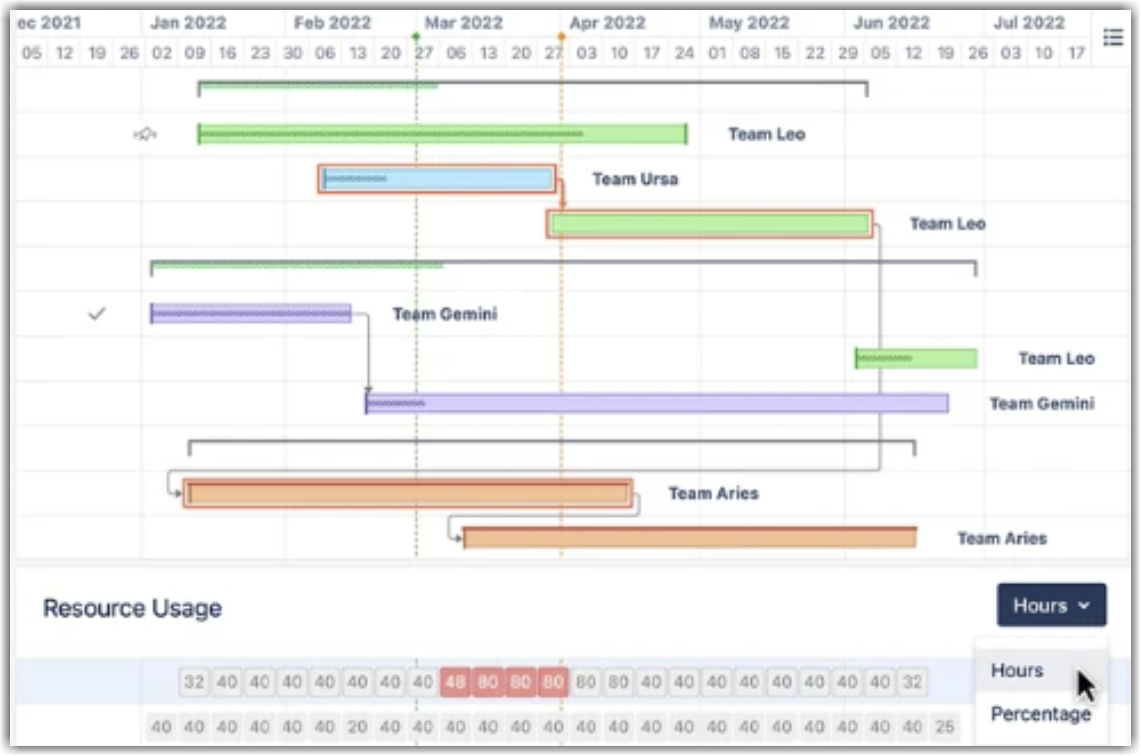
Adding Structure.Gantt makes it easy to identify and resolve overallocations across projects and portfolios.
Sprint Planning
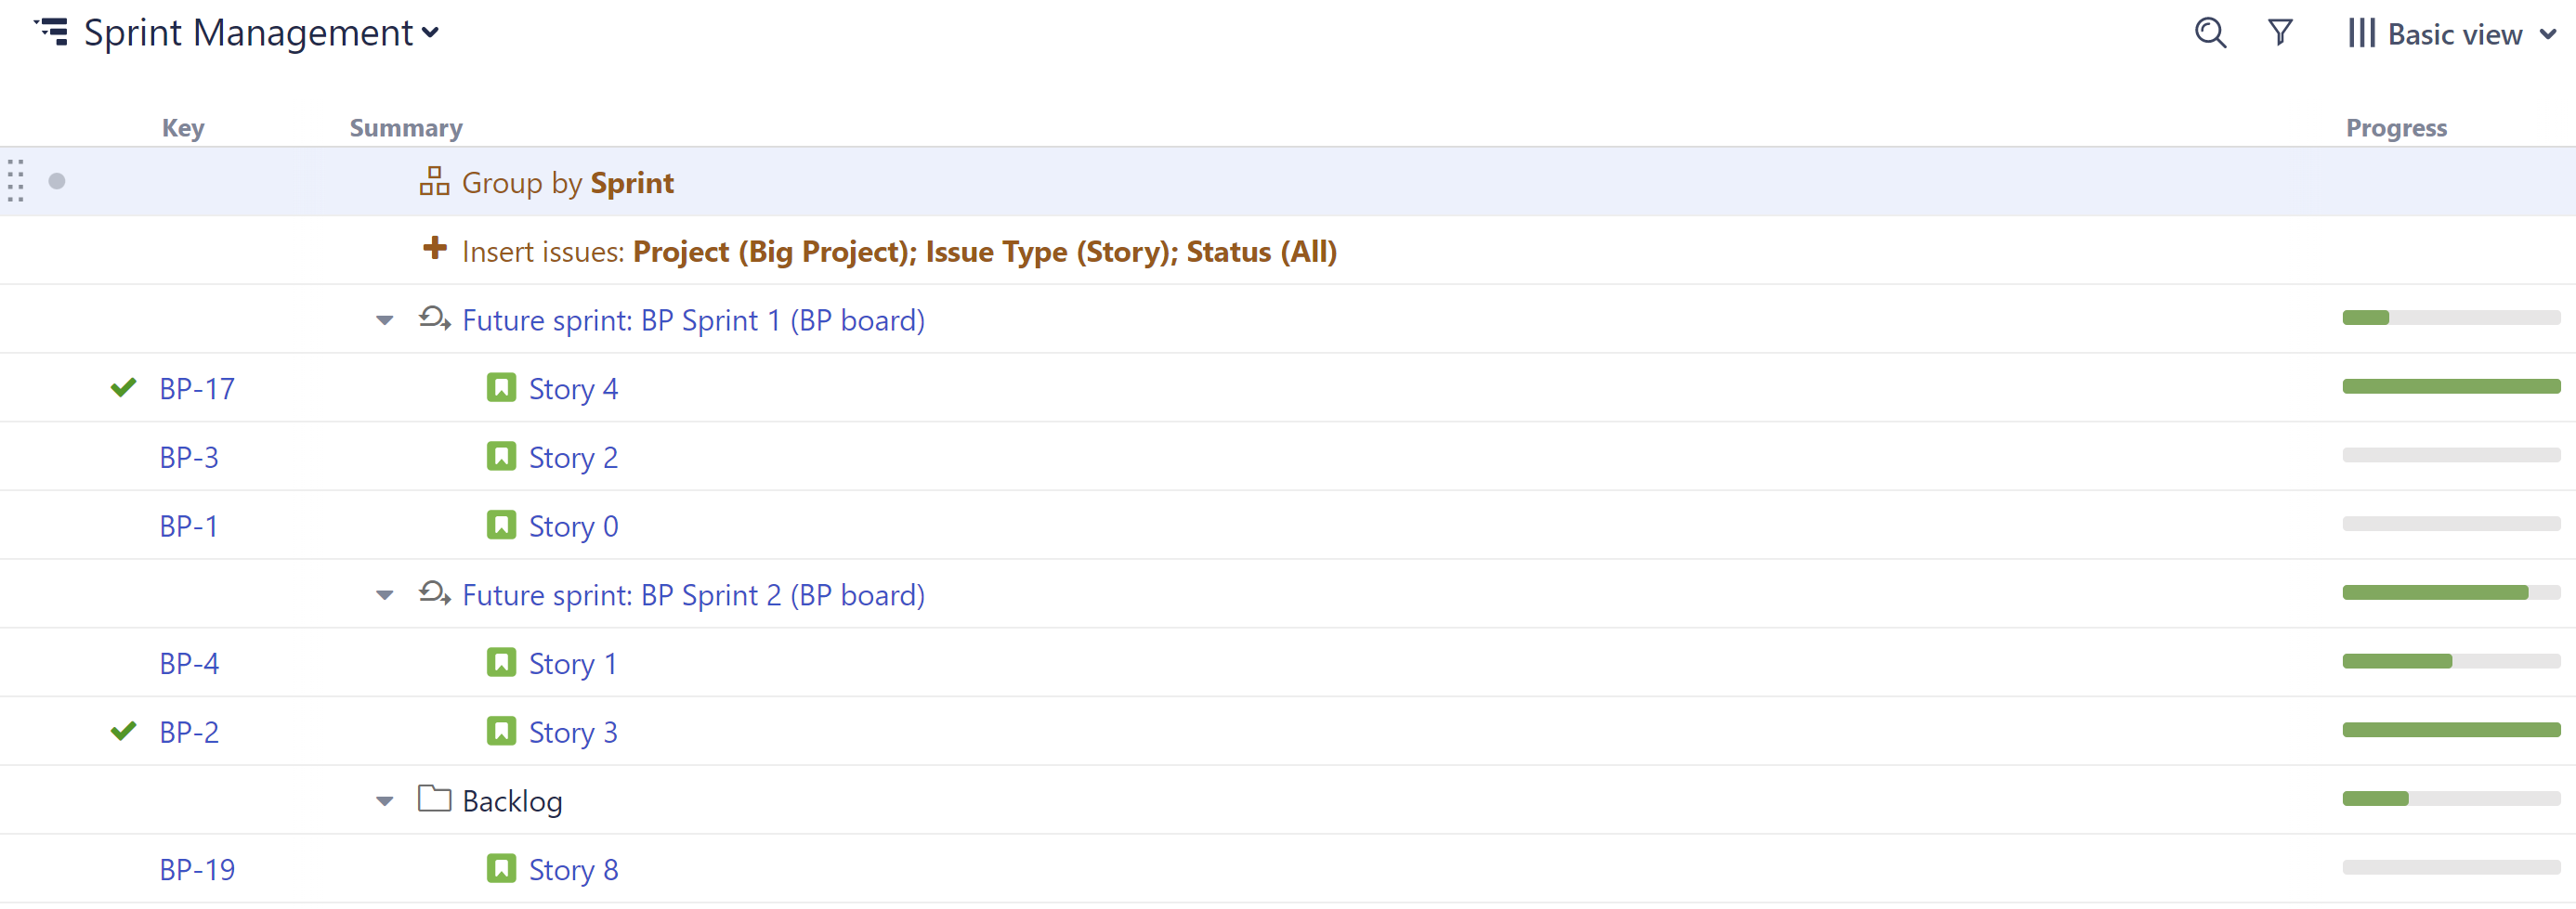
With Structure, you can track all the work items for upcoming sprints – even if they're from different spaces – and visualize all the data you need to track on a single screen. You can even aggregate that data for each sprint.
Step 1: Build a Sprint Planning Structure
To create a new structure:
-
Open the Structure Selector menu and select Create New Structure
-
Add work items: +Add | Insert | Basic Insert
-
Group work items by fix version: +Add | Group | Field | select "Sprints"
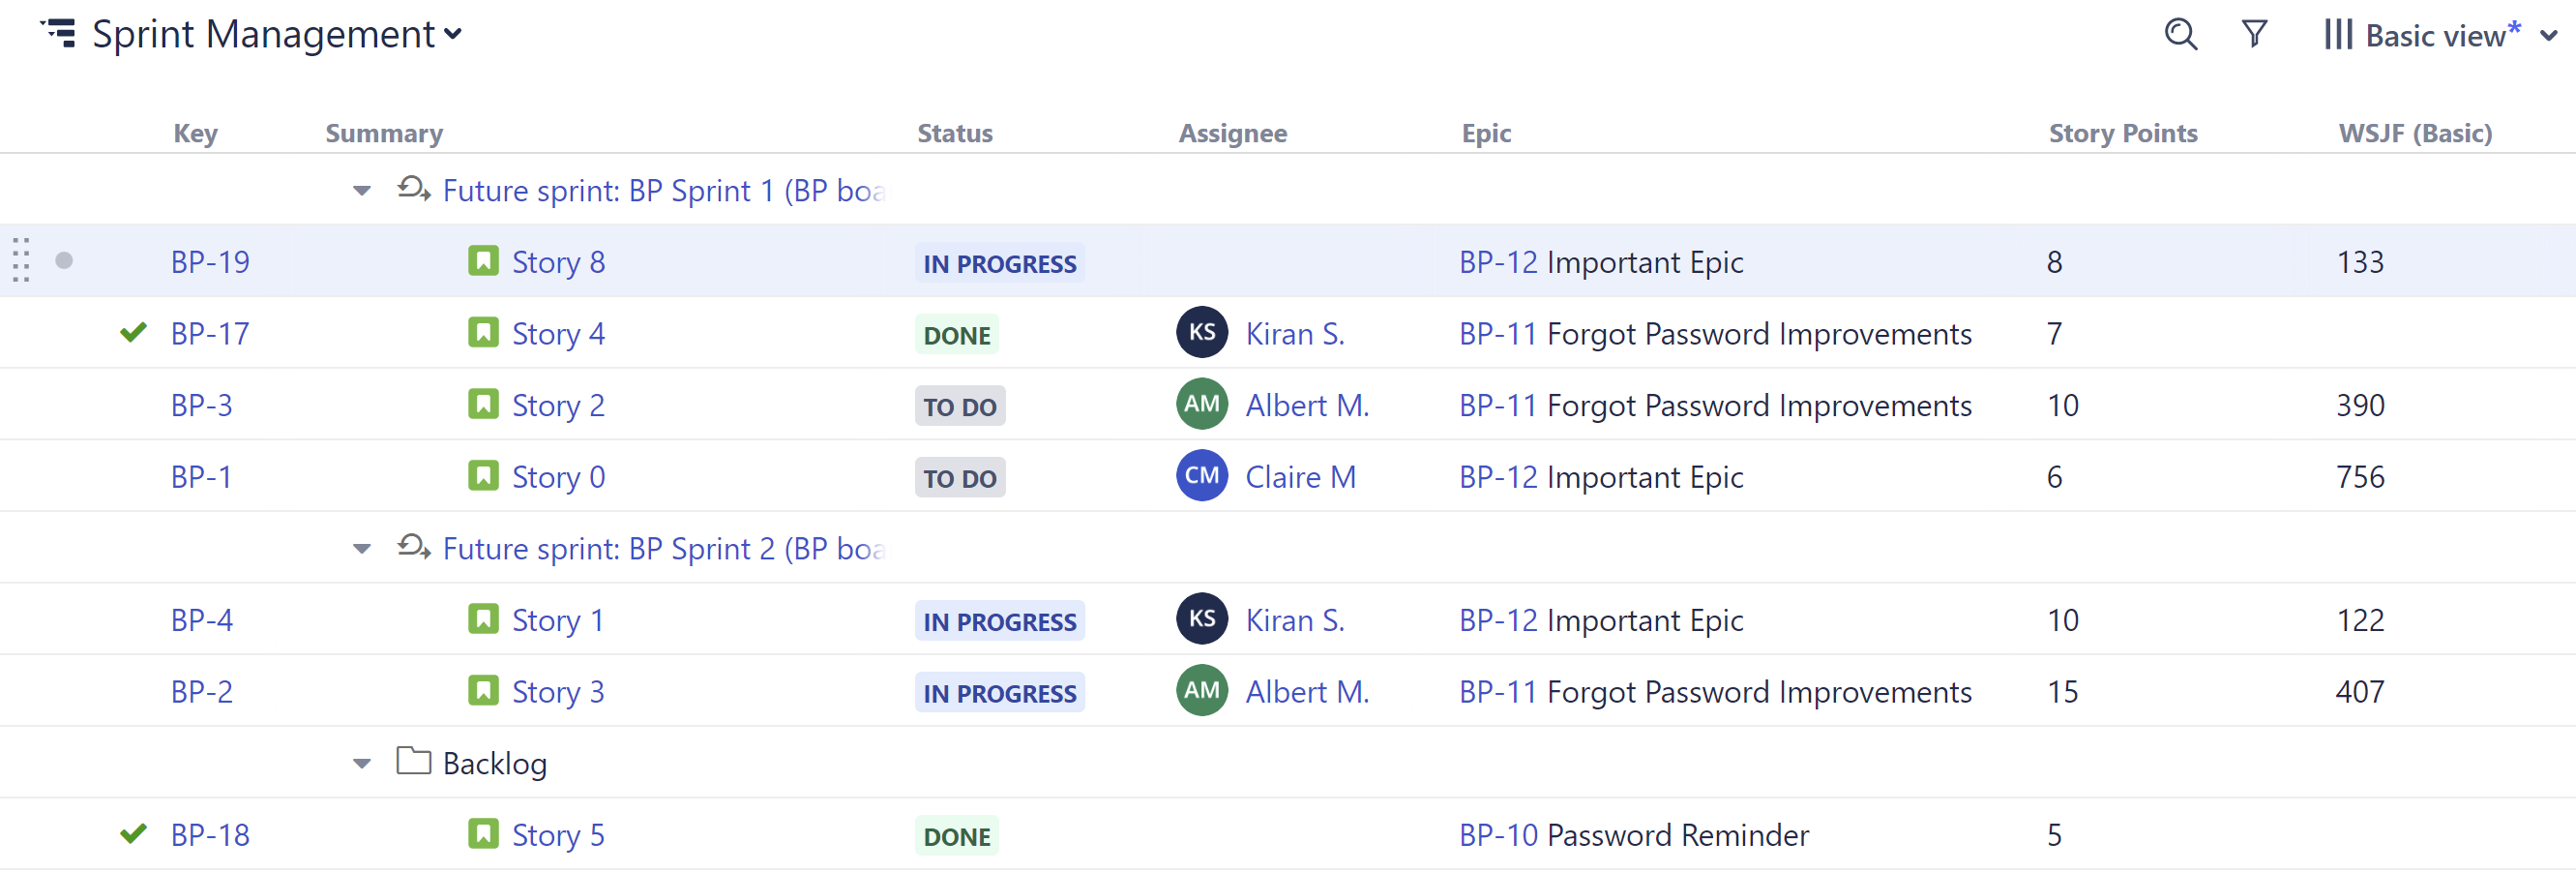
Step 2: Add Data
Next, add the data you'll use to compare work item priority:
-
Click the + button at the top-right corner of the structure
-
Select the fields or attributes you want to compare - we recommend:
-
Status
-
Assignee
-
Epic
-
Story Points (if you’re using them)
-
WSJF (or any other metric your team uses to prioritize work items or assess business value)
-
-
Click the header of any column to sort your work items by that value.
Step 3: Assign Work Items
To assign work items to a sprint, drag it from the backlog to the appropriate sprint. You can also reassign work items by dragging them from one sprint to another. 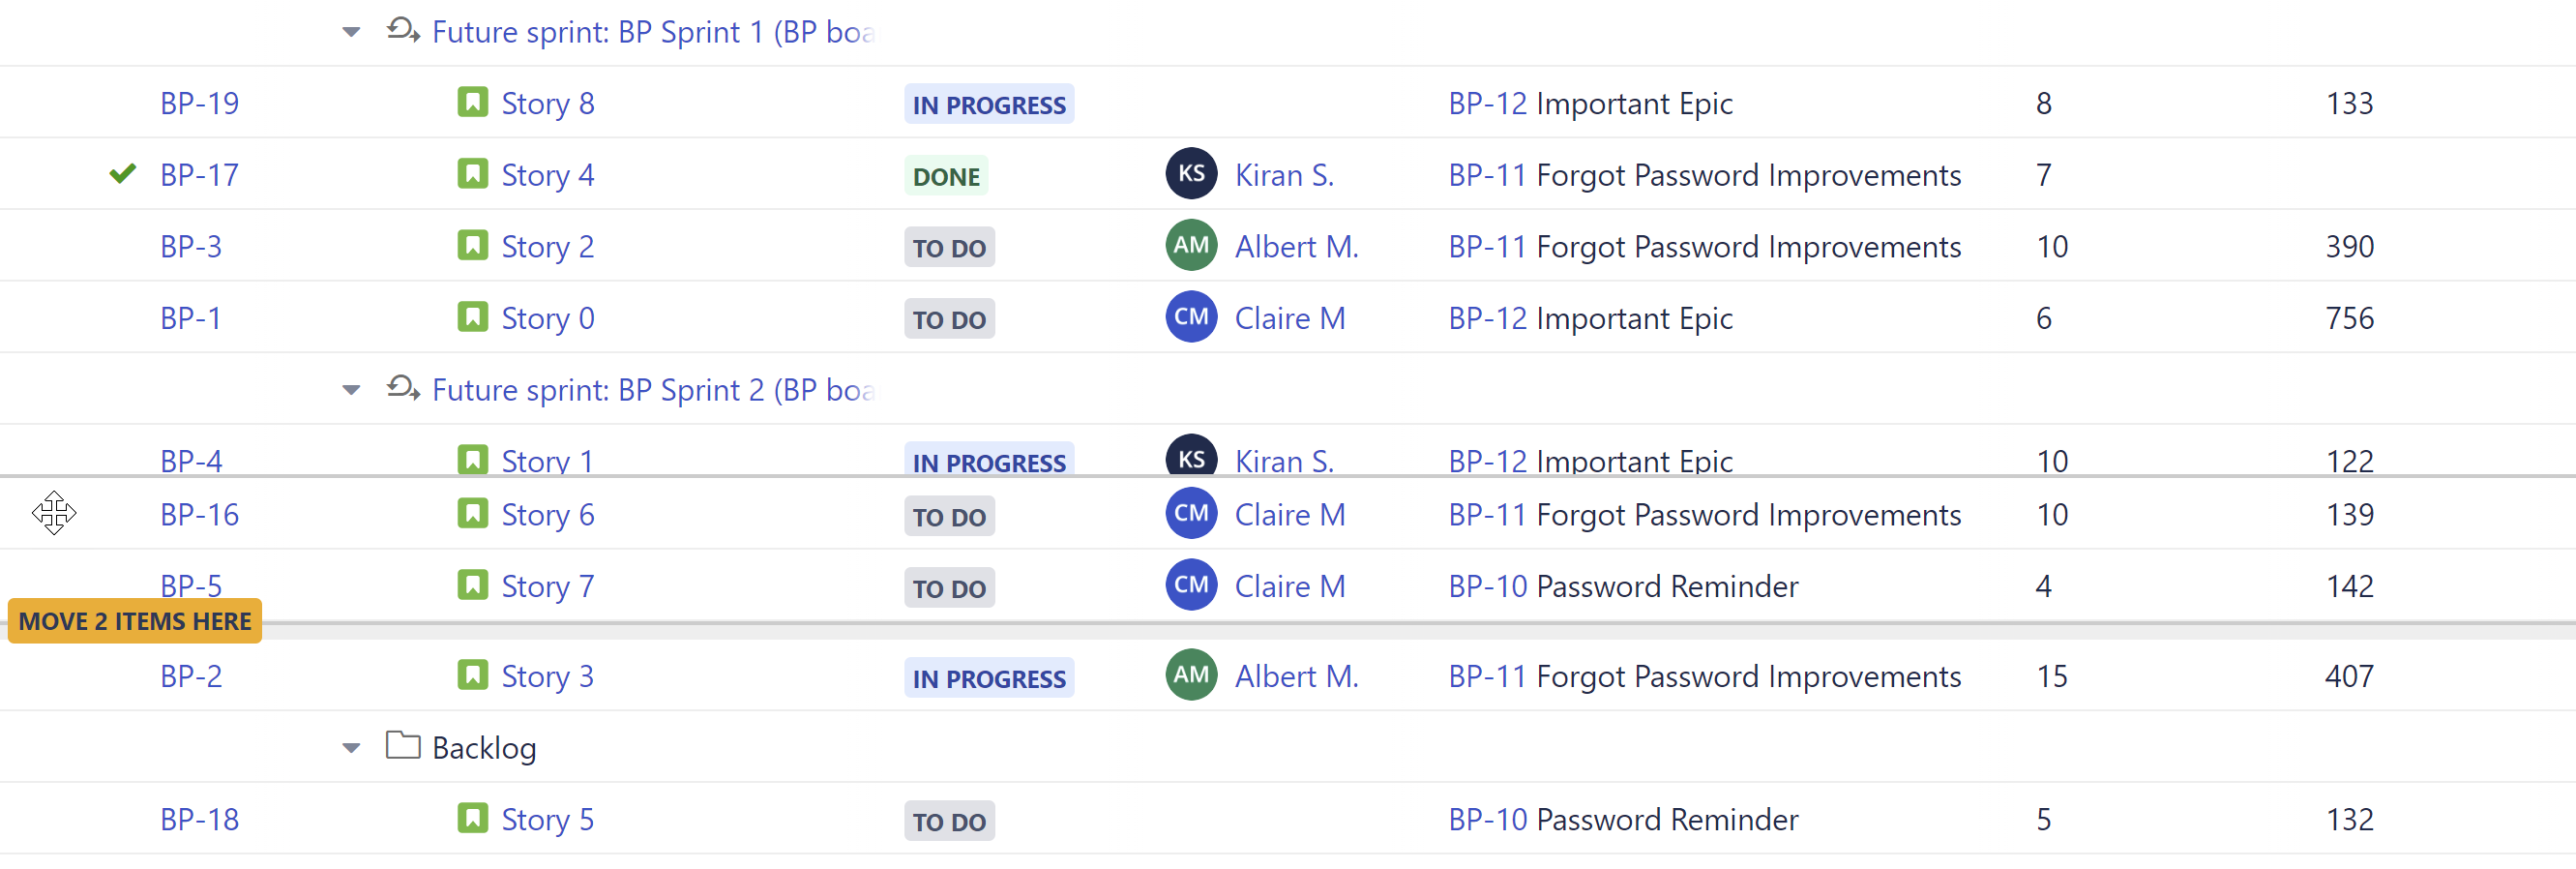
Optional Enhancements
-
Aggregate values for each sprint: when adding a column (such as Story Points), select Sum over sub-items
-
Group by assignee under each sprint to see how the work is divided across your team: +Add | Group | Field | Assignee
-
Use Structure.Gantt to view any blocking dependencies between work items (to help prioritize them)