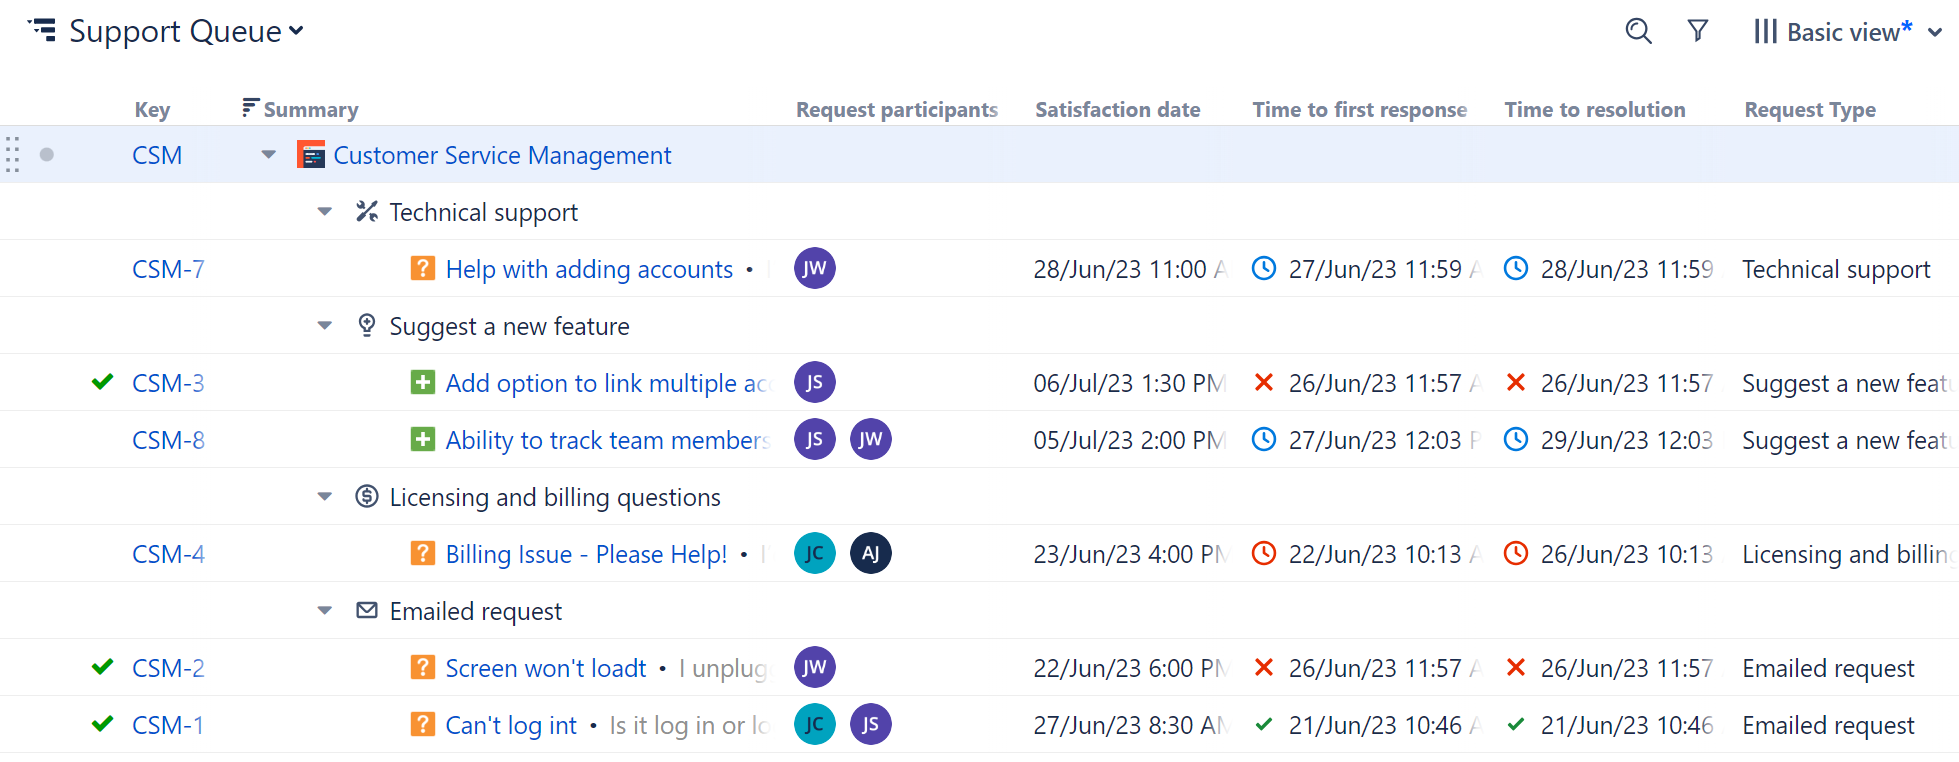
Visualize your entire JSM support queue (even if it's divided into multiple projects), organize data to meet specific needs, and analyze that data with columns and formulas.
Build a Support Structure
You can build your support structure using either Speed or Power Mode. If you have a large support queue, Power mode may work better because it provides extra flexibility when limiting the work items you initially insert.
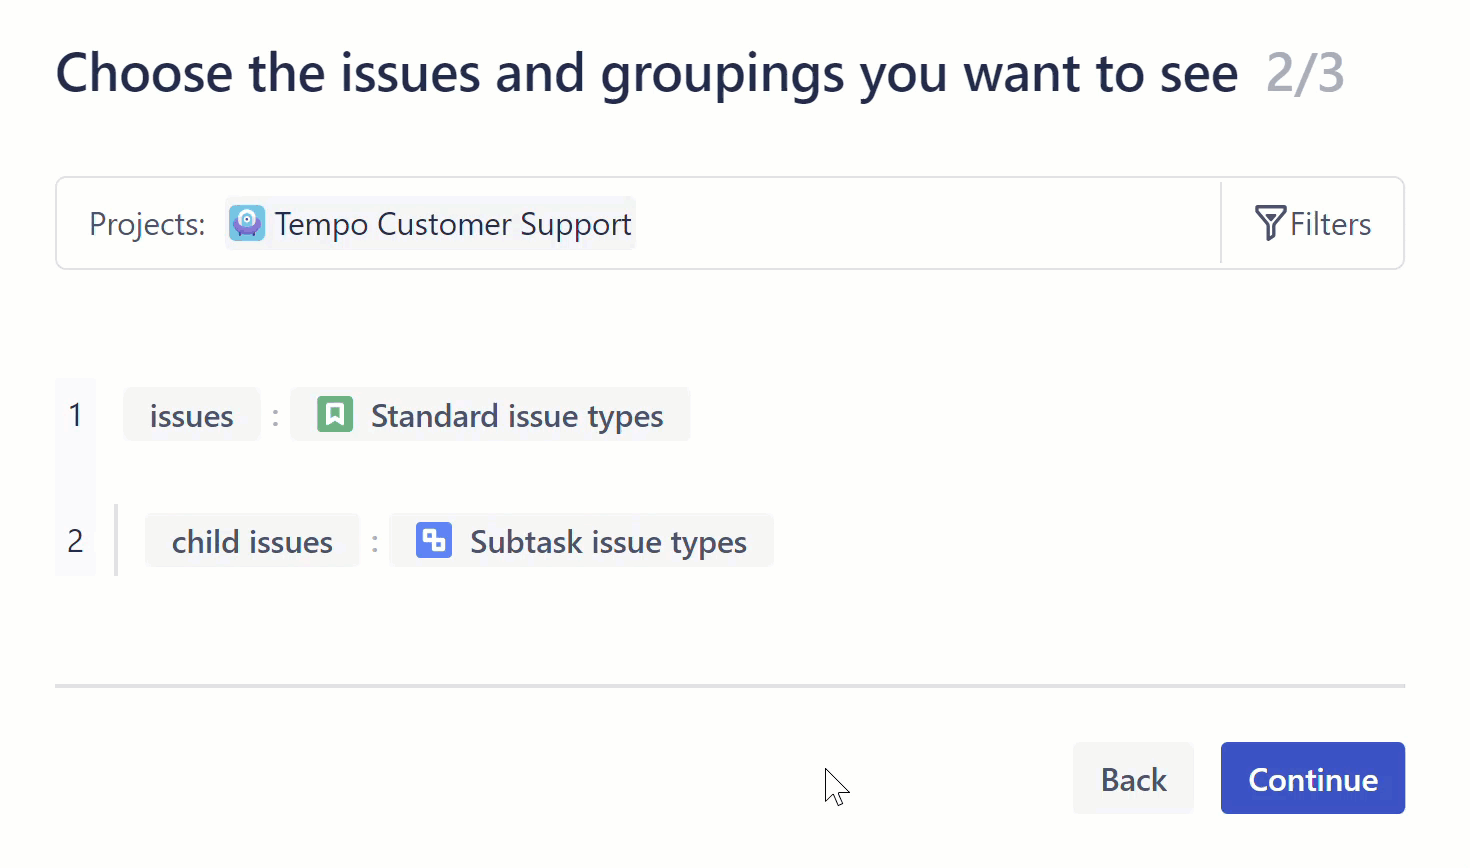
Build a support structure in Power mode
To create the structure above, we used the Basic Insert generator to add all of our Service Management projects that were in a To Do or In Progress status category.
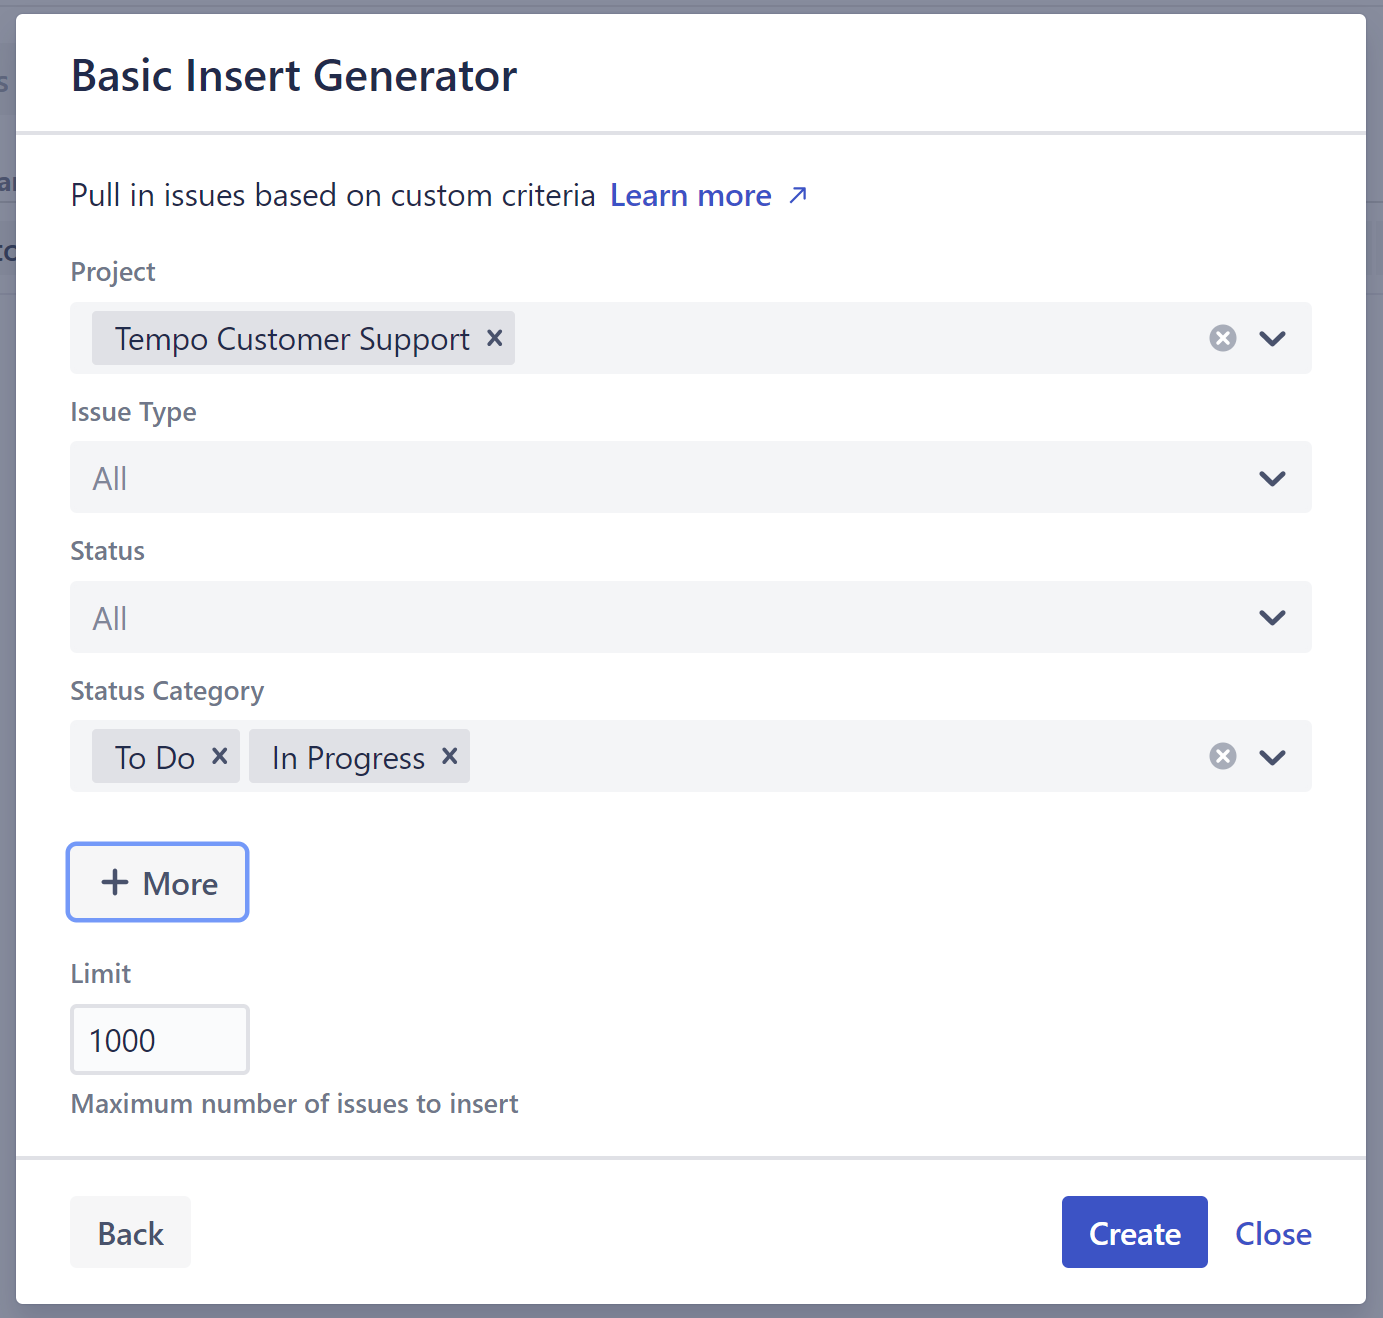
We removed Done items in order to limit the number of items in our structure. If you want to include Done items, you could also use a JQL inserter and limit the work items by dates or other criteria.
Then we added a Group by Field generator to organize our work items by Issue Type.
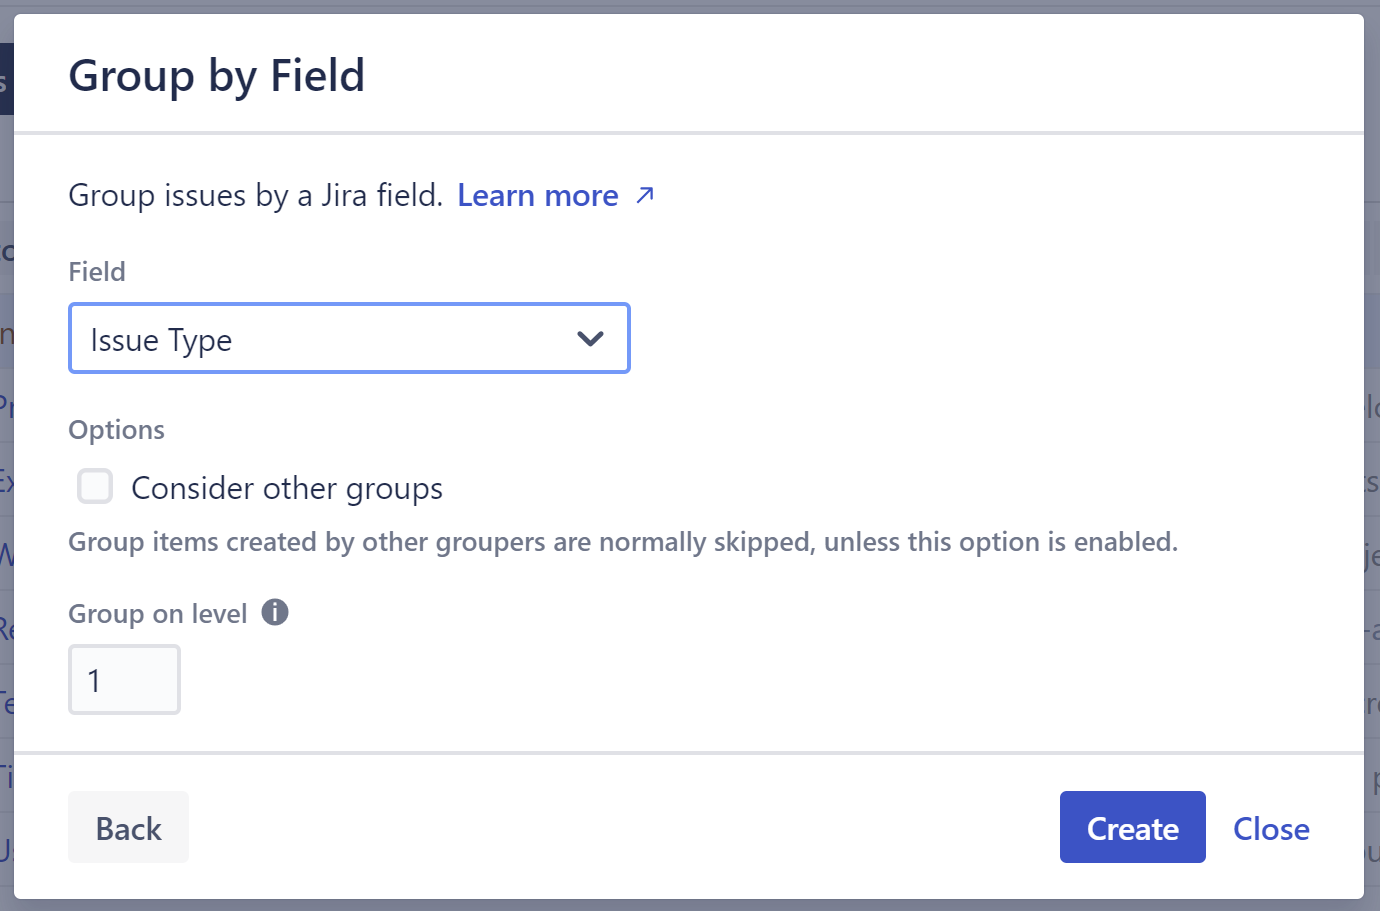
Need to see who's doing the work? Try grouping by Assignee, Team, or another field.
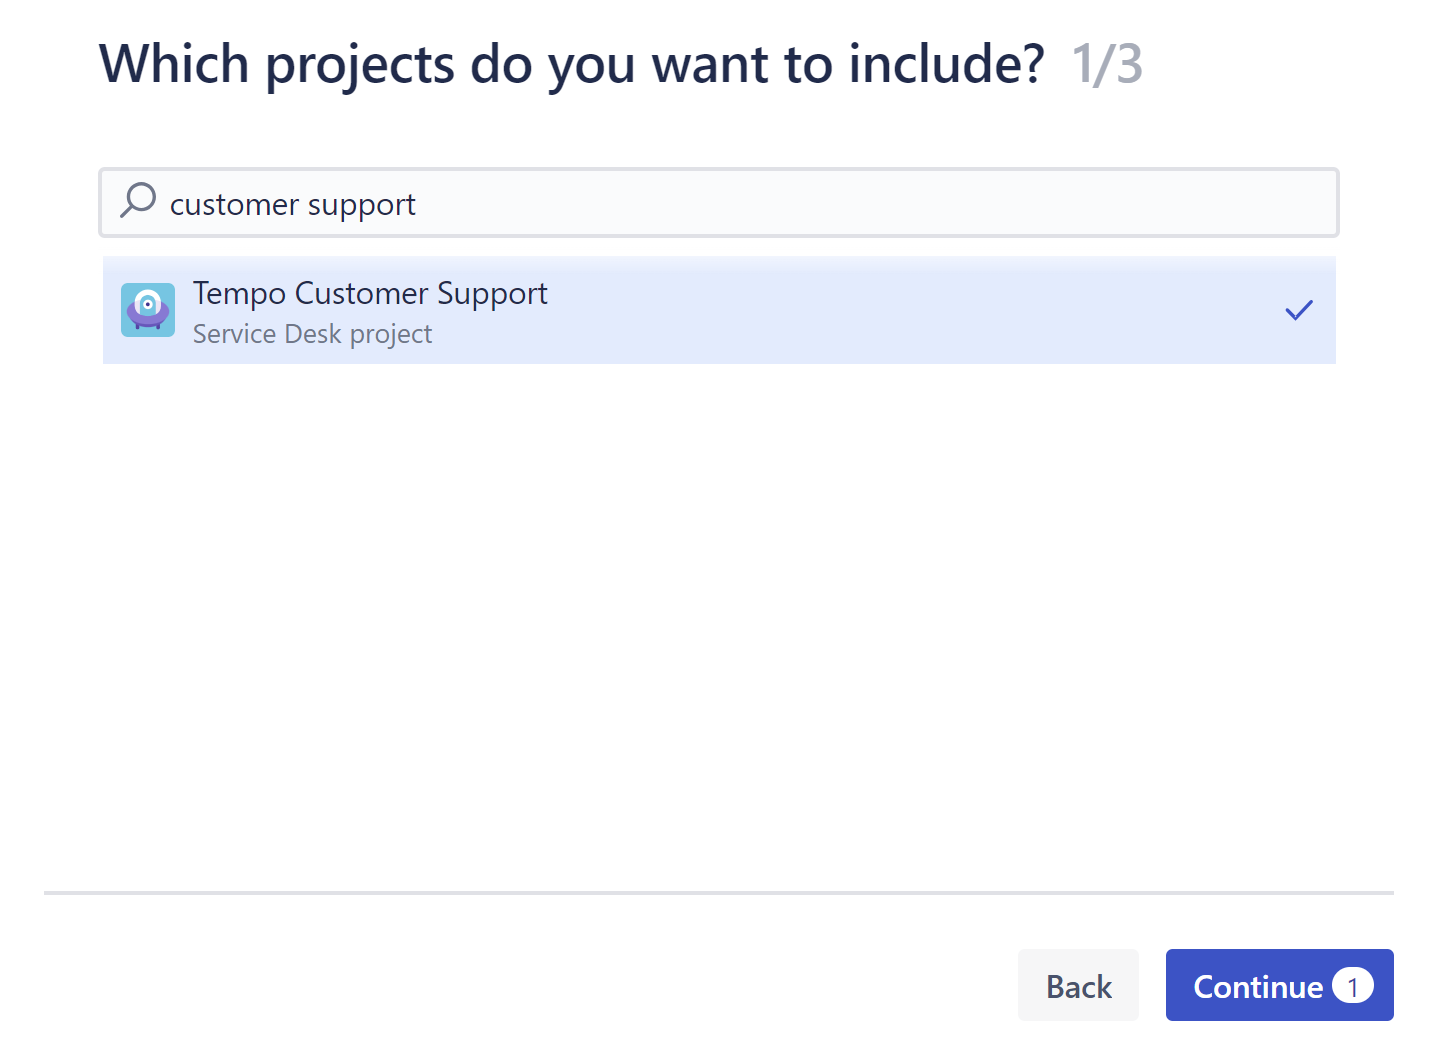
Build a support structure in Speed mode
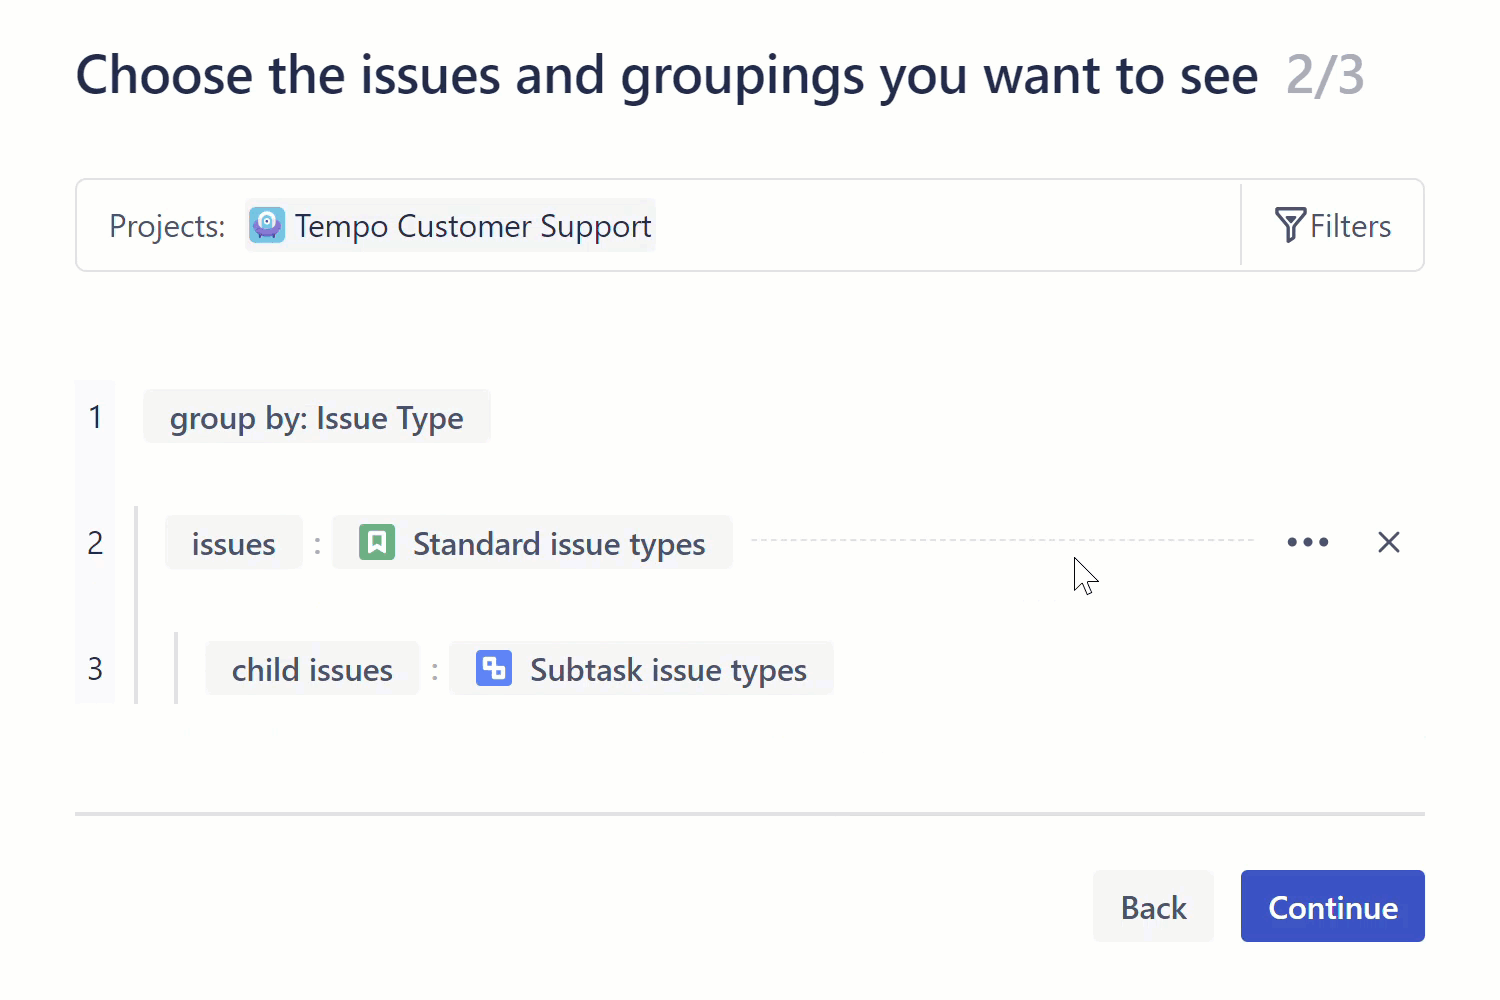
You can also create you structure using Speed Mode. First, search for and select your Service Management projects.
On the hierarchy screen, add a grouping level above your standard issue types - we've grouped our items by issue type. If you want to include additional issue types, or organize your hierarchy differently, you can do that here as well.
If you have a large queue, you may want to filter your results: hover over the Standard issue types line, click the the three dots, and select Filter.
Add Service Management Columns
Once you've created your structure, you'll want to add columns for the data you most need to track. The following Service Management columns are available in Structure:
-
Request participants
-
Request type
-
Satisfaction date
-
Time to close after resolution
-
Time to first response
-
Time to resolution
-
Time to review normal change
You can also build custom reports based on most of these fields by adding Formula columns.
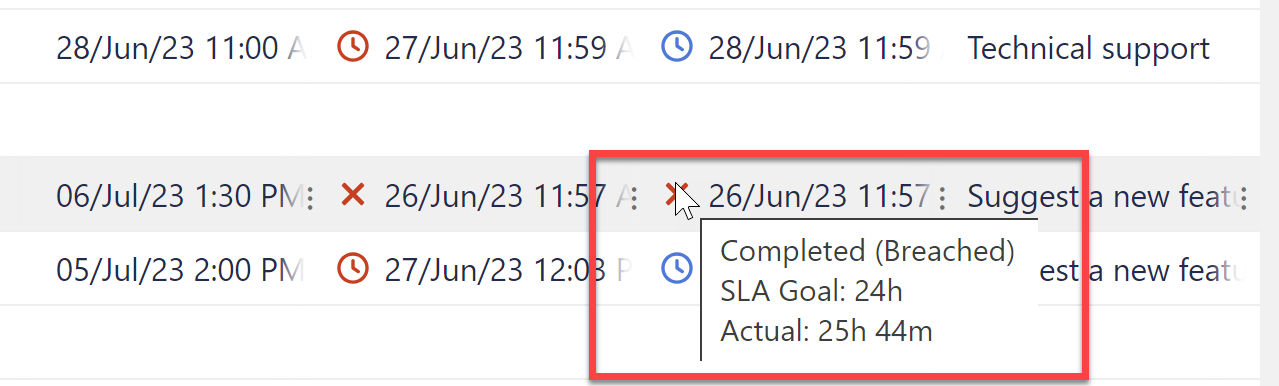
View SLA Information at a Glance
"Time to..." columns include icons which provide at-a-glance information about each ticket's timeline and SLAs:
|
|
The ticket is still open and within the set SLA |
|
|
The ticket is still open, but the SLA has been breached |
|
|
The ticket was closed within the established SLA |
|
|
The ticket was closed, but the SLA was breached |
You can view additional information by hovering over the field value.
Focus on Specific Work Items
After you've built your structure, you may want to rearrange or filter work items to focus on specific parts of your queue. This can be easily accomplished by creating Filters and Group, which make temporary, local changes to the structure.
Share with Your Team
If you share the structure with your team, they can quickly view just their work items by applying the Assigned to me saved Filter.