HAR Network Report is something we (Tempo Support) may ask you to collect, to help us understand a tricky problem that we could not reproduce.
HAR stands for HTTP Archive Format, a text-based format for the log of network communications between a user agent (the browser) and a web server. You can also use this report with a HAR Viewer for in-depth analysis of your JIRA page load performance. (Be aware though that with an online viewer you may transfer sensitive or security-related information to a third party.)
Collecting HAR Report with Google Chrome
-
Open a new Chrome window and navigate to the page where the problem happens.
-
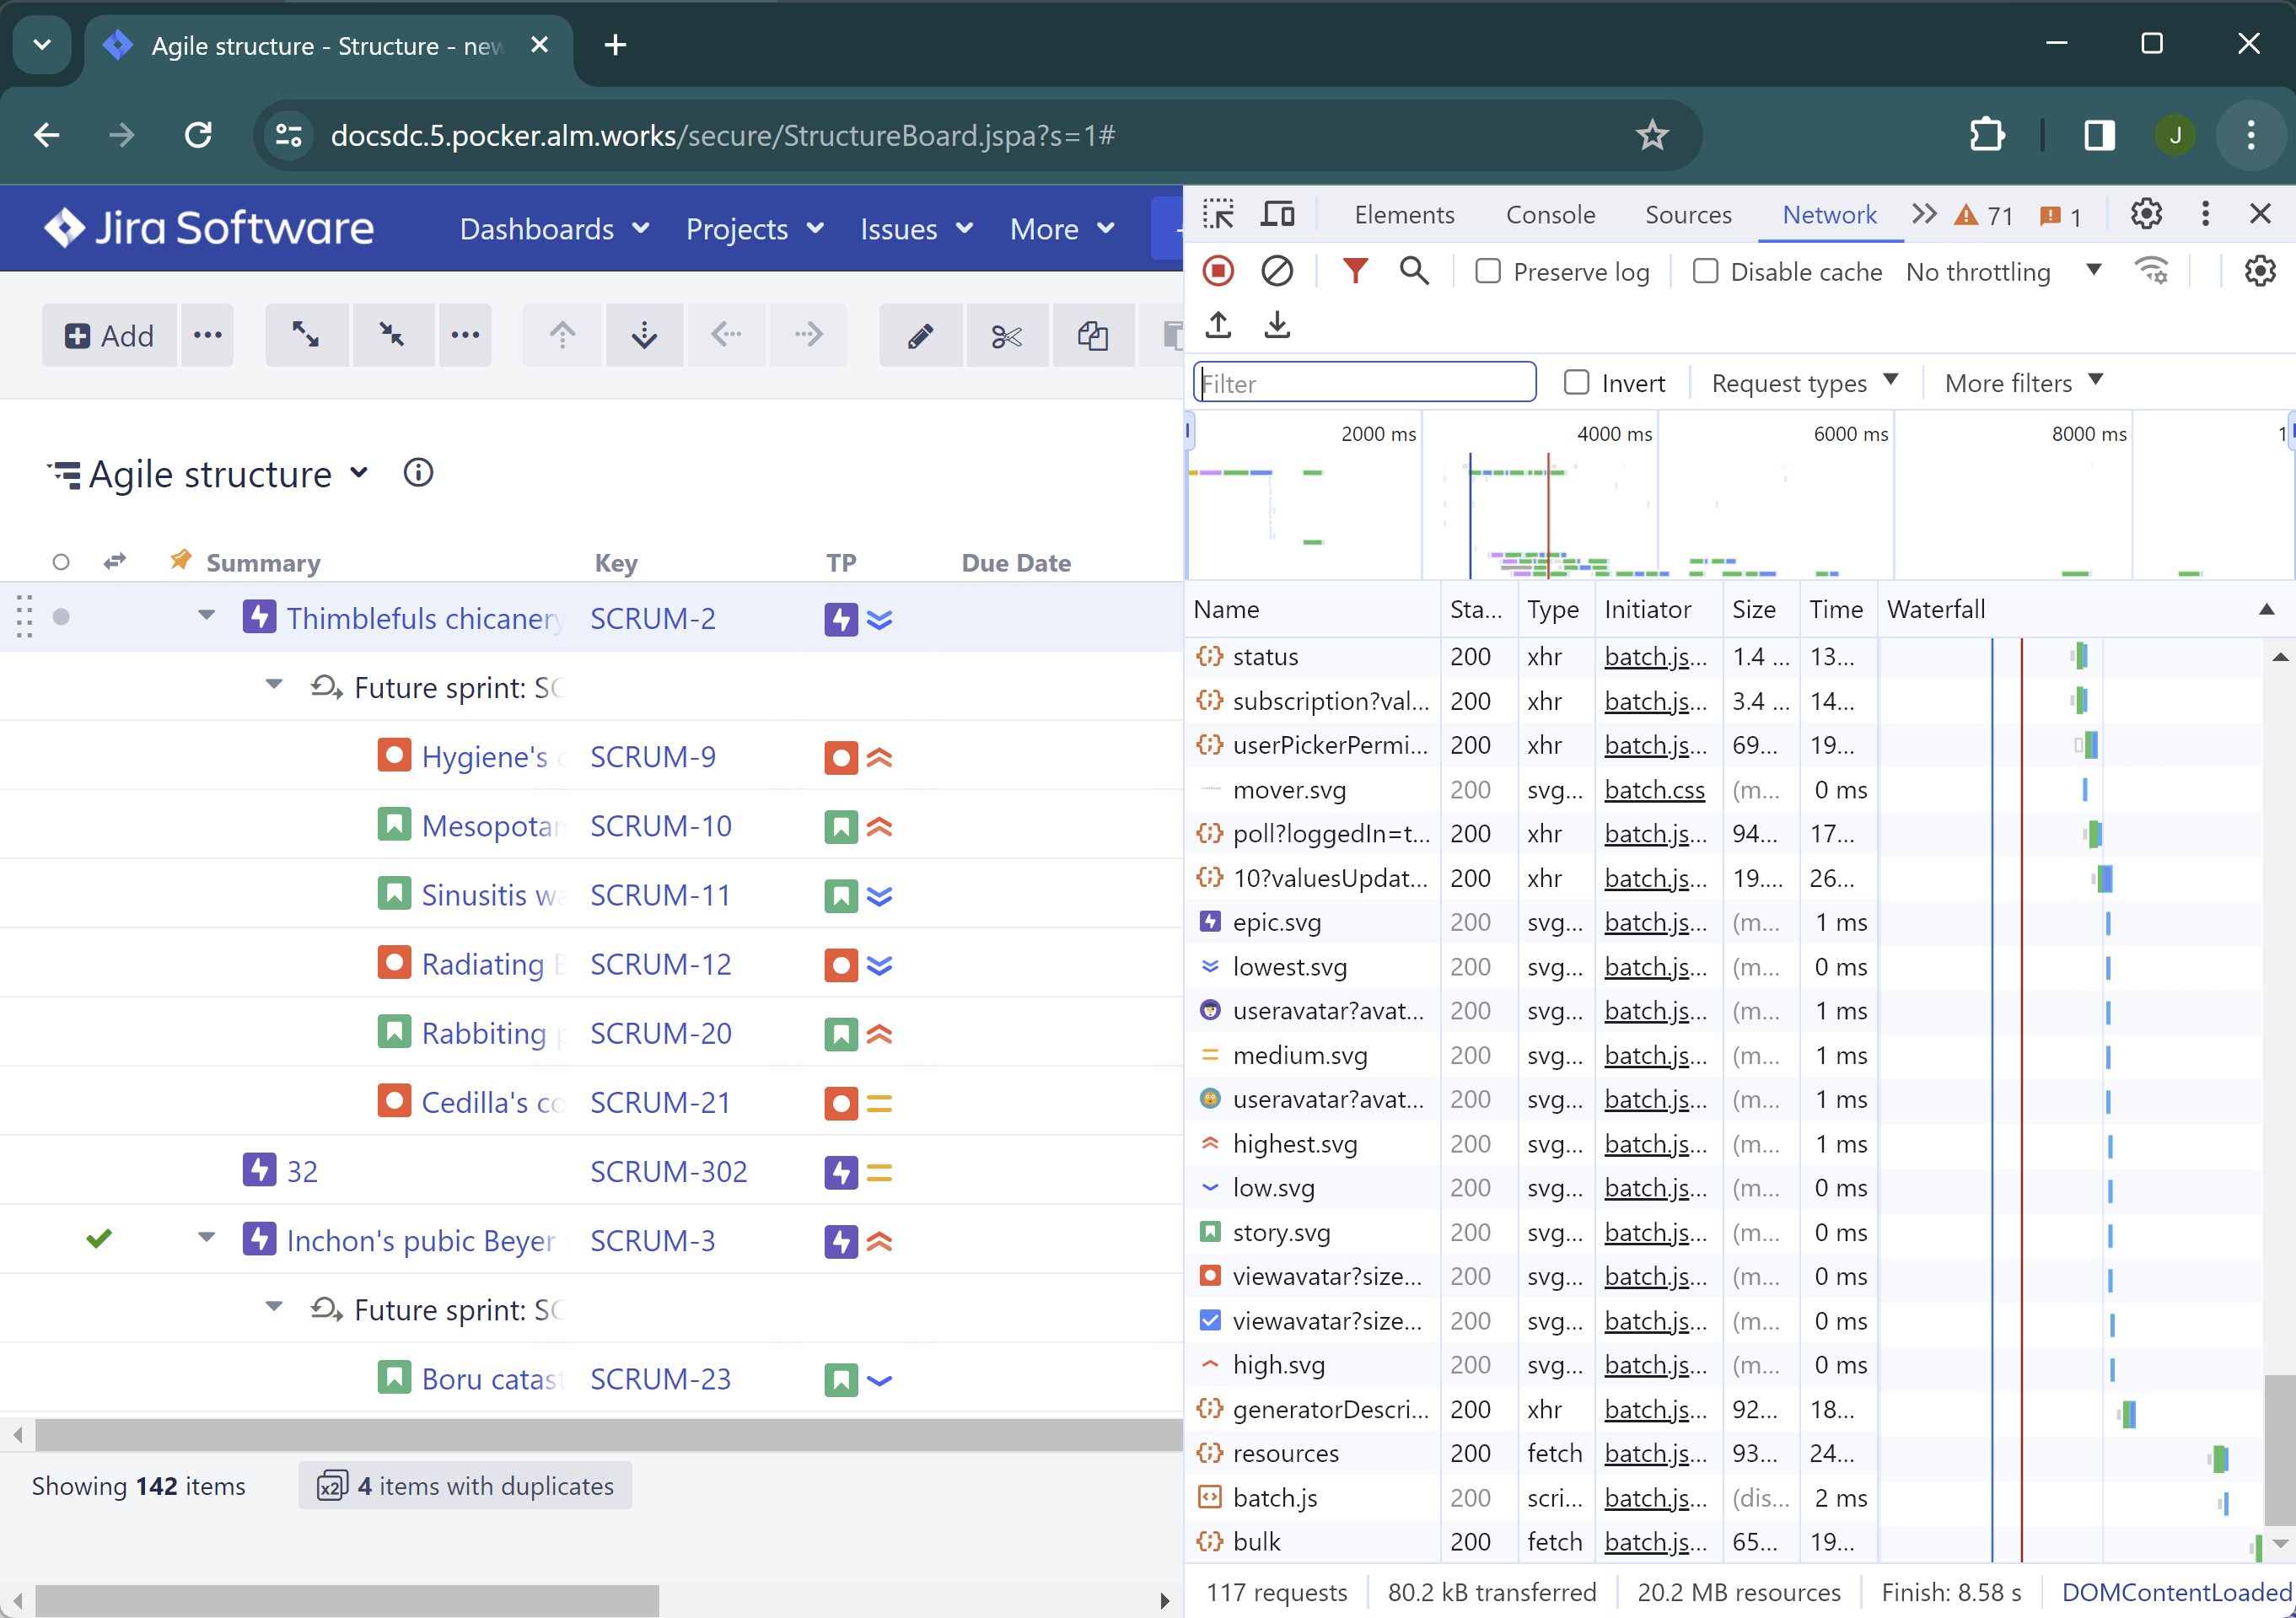
Press Ctrl+Shift+I or use menu Wrench | Tools | Developer Tools to open a section with developer tools. Switch to the Network tab there.

-
Reload the page by using Ctrl+R or clicking the Reload button. This will make Network tab log all network exchange during page load.
The network tab will start collecting information or network exchange automatically after it's opened. If you know that the problem is not related to the initial page load, you may skip this step to avoid adding extra data to the log. If unsure, reload the page to collect the full report.
-
Reproduce the problem being analyzed.
-
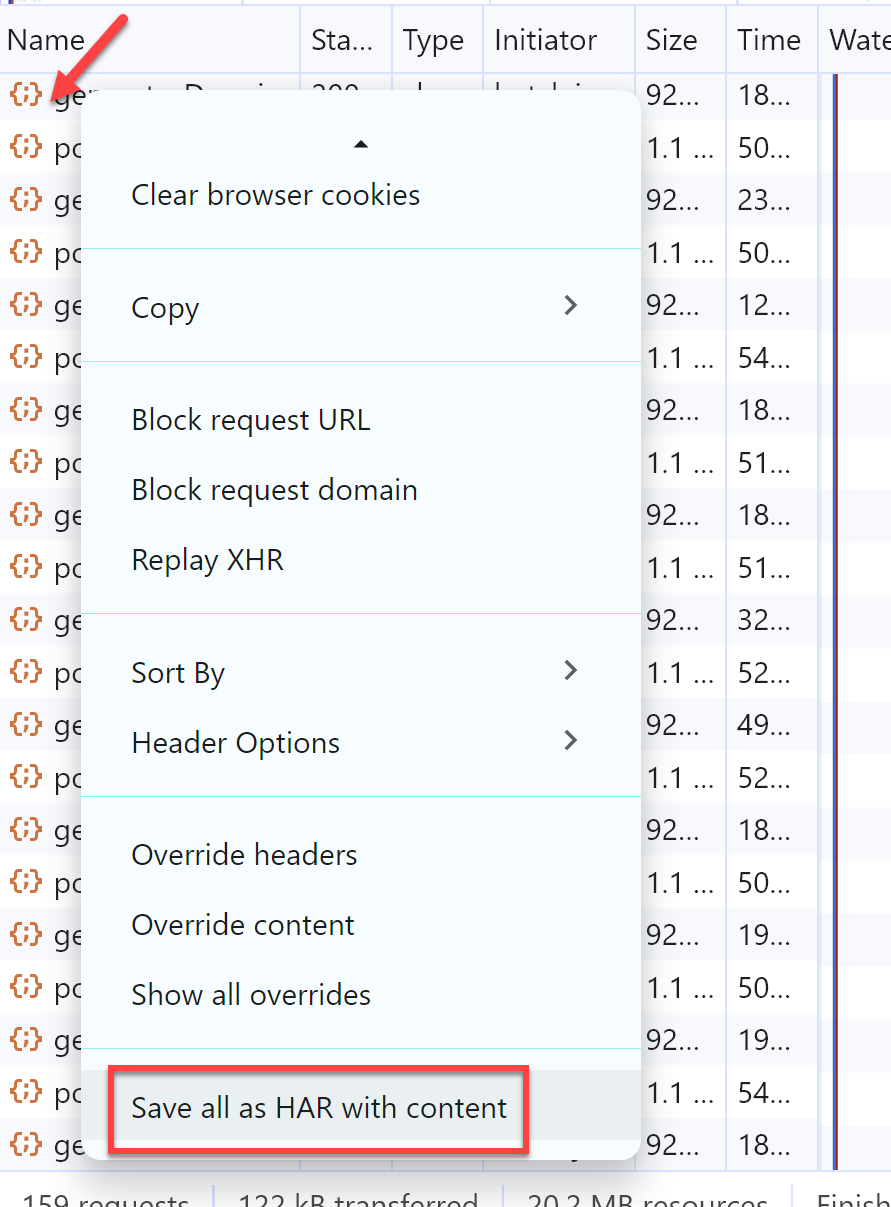
After the problem has been reproduced, right-click on the Name column in the Network tab and choose either Save all as HAR or Copy all as HAR

-
Paste the report into an e-mail to our support, or attach the saved .HAR file.
