As of February 1, 2025, Time Tracker Lite is deprecated. Visit this page for more information on how to migrate to Time Tracker.
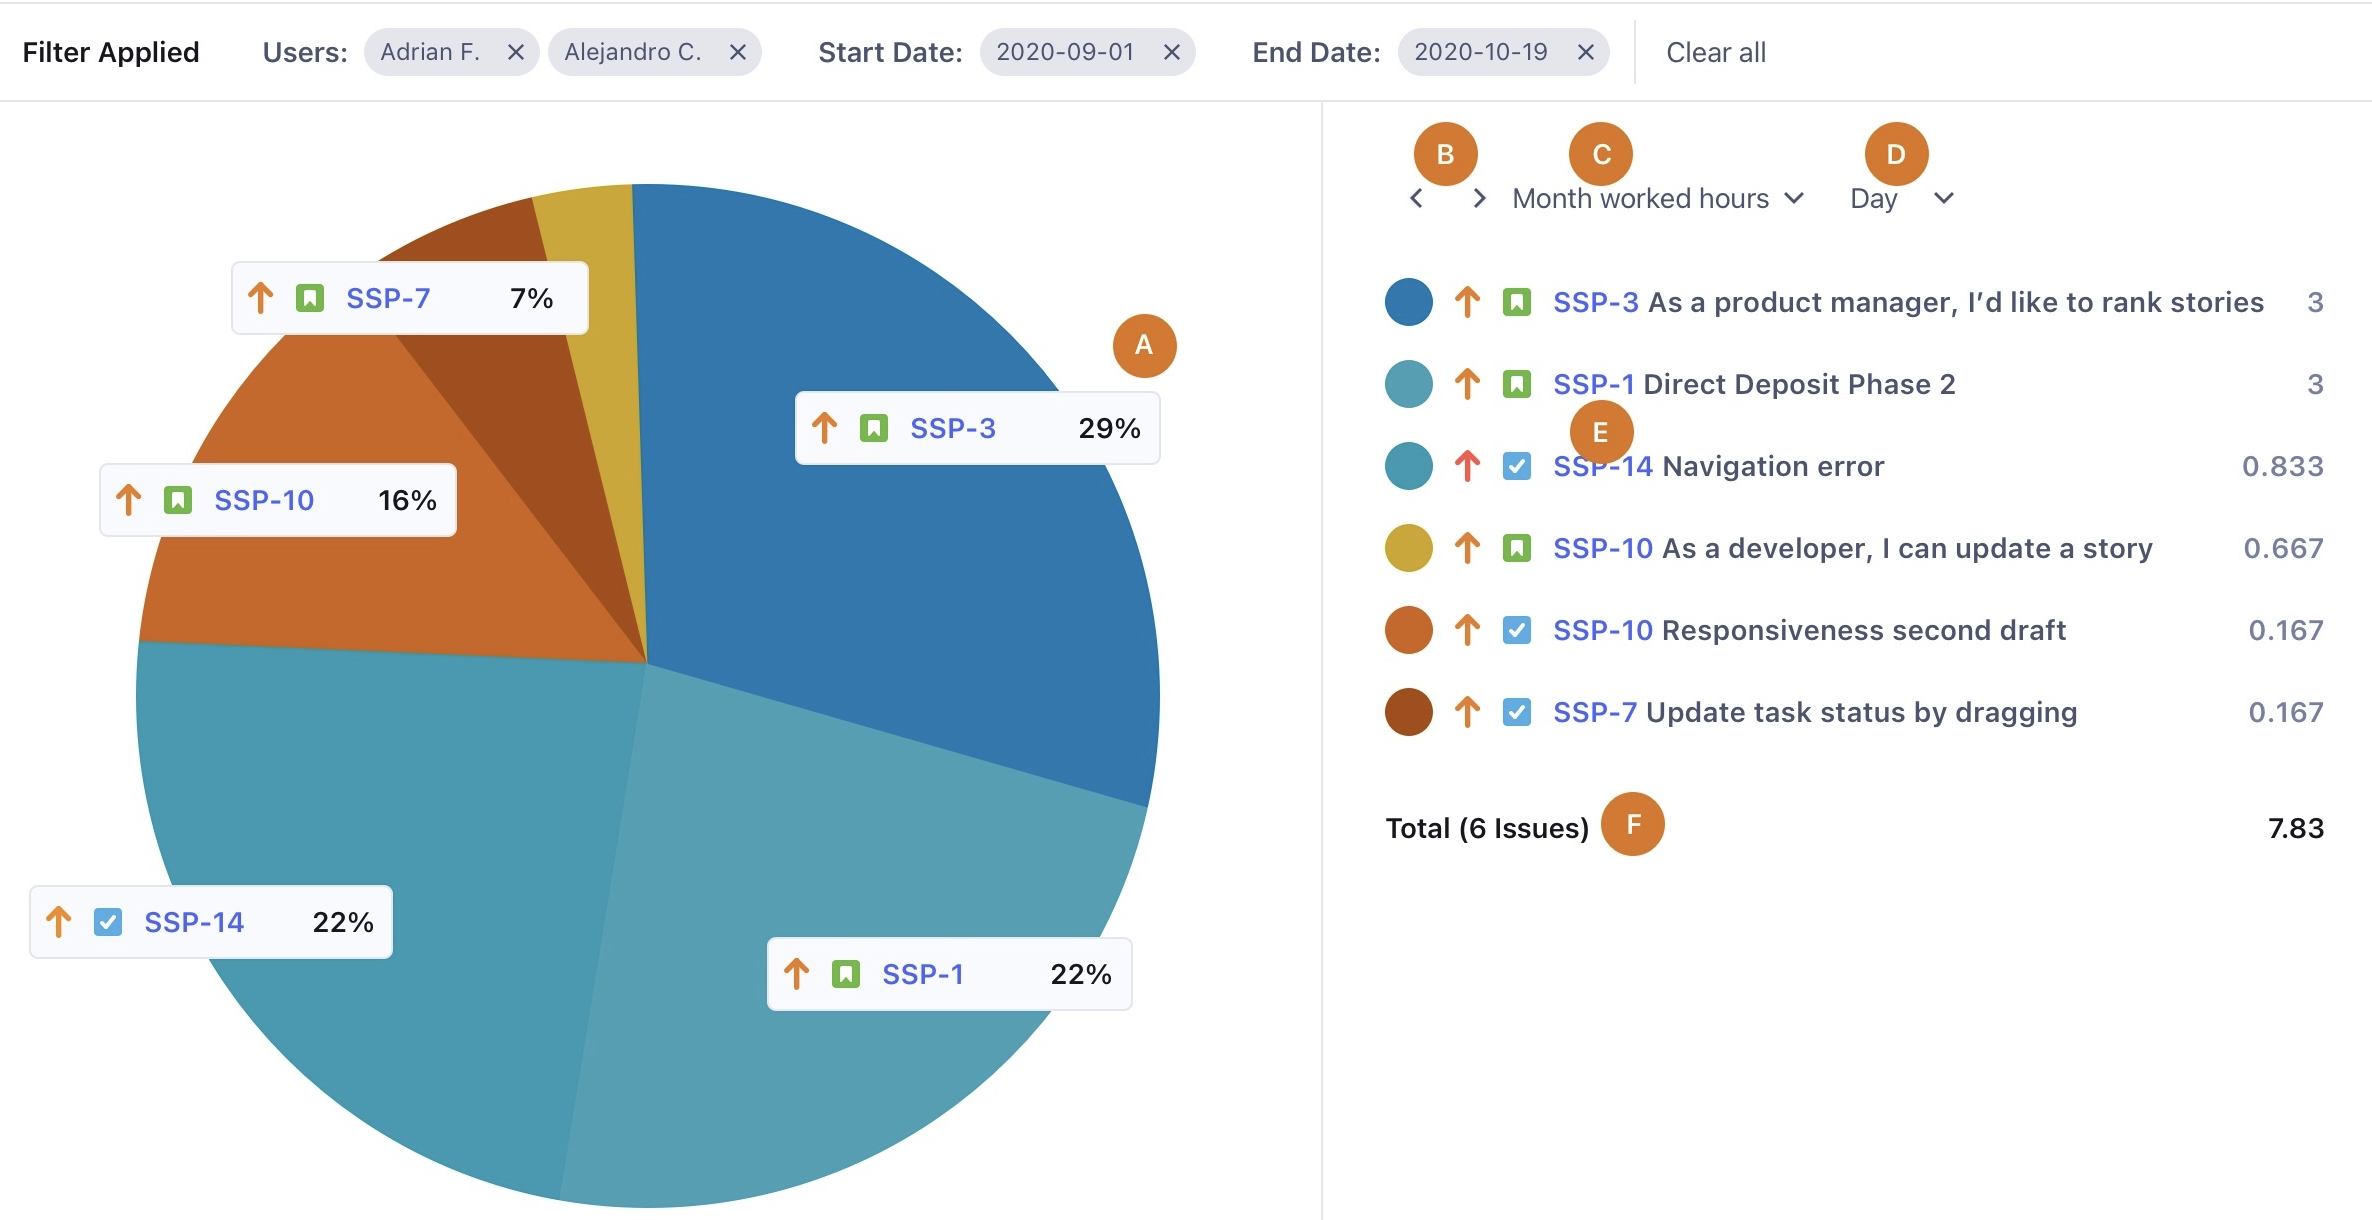
The Pie Chart Report displays a visual summary of the time worked on a project in a certain period.
|
Element |
Description |
Details |
|---|---|---|
|
A |
Pie Chart |
Displays the issues for the selected period. Wedges are sized according to the percentage of time worked. Select any issue number to access the full issue. |
|
B |
Previous and Next icons |
Select to scroll to the previous or next week. |
|
C |
Month Worked Hours dropdown |
Select to display the daily, weekly, or monthly worked hours. |
|
D |
Time display dropdown |
Select to display the day, week, or month. |
|
E |
Issue list |
Displays the list of issues for the period selected. Select any issue number to access the full issue. |
|
F |
Total row |
Displays the total time spent on the issues in the selected period. |