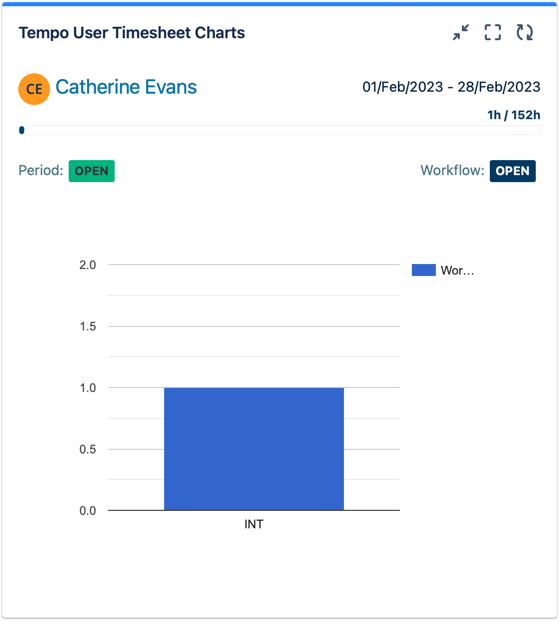
The User Timesheet Charts gadget shows your logged time for a current period. The data can be displayed using pie chart, column chart, or area chart.
For information about how to add the gadget to your Jira dashboard, see Tempo Gadgets.
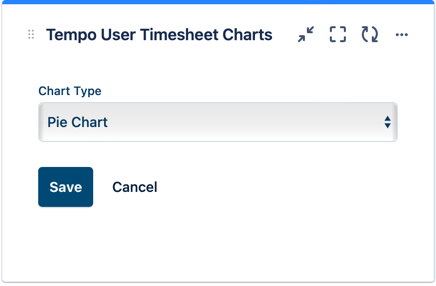
To configure the User Timesheet Charts gadget:
-
Go to your Jira dashboard and click … in the upper-right corner of the User Timesheet Charts gadget.
-
Select Edit.
-
Select the chart type in Display to illustrate the data in the most meaningful way to you.
-
Select how often you would like the date to be refreshed in Refresh Interval.
-
Click Save to display the results in a graph.
-
The gadget is displayed in the dashboard with the filtered criteria.