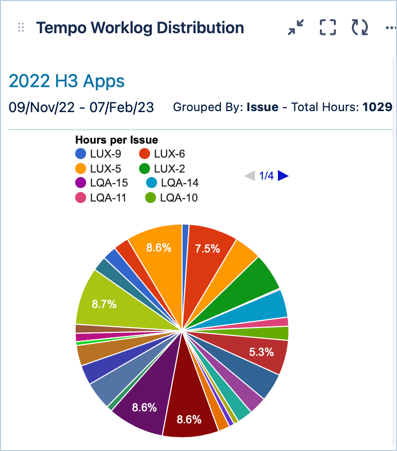
The Worklog Distribution gadget helps you to analyze or get an overview of worklog distribution. You can view the data in a column or pie chart.
For information about how to add the gadget to your Jira dashboard, see Tempo Gadgets.
Viewing worklog distribution of other users in the Tempo User gadgets requires the View All Worklogs permission for the Jira spaces in the filter being used.
To configure the Worklog Distribution gadget:
-
Go to your Jira dashboard and click … in the upper-right corner of the Worklog Distribution gadget.
-
Select Edit.
-
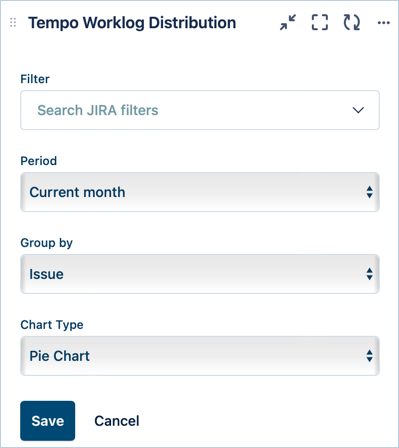
Edit the gadget configuration:
-
Filter – All available Jira work item filters.
-
Period – Select the time period you want to display.
-
Group by – Select how the information should be grouped.
-
Chart Type – Select the chart type to illustrate the data in the most meaningful way.
-
-
Click Save to display the results in a graph.
-
The gadget is displayed in the dashboard with the filtered criteria.