Analytics
Calculate the time needed to burn down the backlog
Assuming your team can accomplish 10 story points a week, this will tell us how long (in weeks) it will take to burn down work and get to certain items further down the backlog. To adjust how many story points the team can work in a week, simply change the "velocity" value.
WITH velocity = 10:
  CONCAT(SUM#preceding{story_points} / velocity, "w")
For this example to work most effectively, the structure should be sorted based on how you choose which work to complete first. See Sort Generators for more information.
Calculate days past due
This example checks for items that are overdue and returns the number of days the item is overdue.
IF dueDate < NOW():
   DAYS_BETWEEN(dueDate, NOW()) CONCAT " days late"
Compare the original estimate to work logged and the remaining estimate
IF originalEstimate:
    (timeSpent + remainingEstimate) / originalEstimate
ELSE:
    "not estimated"
Calculate the interquartile range of story point estimates
WITH points = ARRAY { storyPoints } :   // Holds all the story points of the children.
  QUARTILE(points, 3) - QUARTILE(points, 1)
Comments
Show the date, author, and text of the latest comment
comments.UMAX_BY($.created).map(CONCAT(
	$.author.user_display_name(),
	" said at ",
	FORMAT_DATETIME($.created, "yyyy-MM-dd HH:mm:ss"),
	": ", $.body))
Show the last comment made by a user
comments.FILTER($.author = "admin").UMAX_BY($.created)
In this example, the last comment made by "admin" will be shown. To show comments for another user, replace "admin" accordingly.
Show the date of the latest comment done by a user
comments.filter(x -> x.author = "admin").map(x -> x.created).max()
In this example, the date corresponds to the last comment made by "admin." To show the date for another user, replace "admin" accordingly.
Display "Answered" if there are comments after my latest one
WITH myLastCommentDate = comments.FILTER($.author = me()).MAP($.created).MAX() :
   IF (comments.ANY($.created > myLastCommentDate); "Answered")
Historical Values
Show the historical value of an issue field at a specific date
In the example below, we're using the Due Date field. You can use any system or custom field.
historical_value(this, "duedate", datetime("15/May/18 6:24 PM"))
Note: this formula also uses the Datetime function
Show the number of tasks added since the last sprint began
SUM {
 IF history.changes
	.FILTER($.field = "sprint")
	.LAST()
	.changeGroup.timestamp > sprint.last().startDate: 1
}
Show who changed the field value
The example below shows who changed the Resolution field, but you can replace "resolution" with another system or custom field:
history.changes
    .FILTER($.field = “resolution”).last().changeGroup.author
Time Flagged: Time the task was marked with a flag
with flag_change_time(value) =
history.changes
  .filter($.field = "flagged")
  .filter($.to = value)
  .changeGroup.time :
with flag_on_time = flag_change_time("Impediment") :
with flag_off_time = flag_change_time("") :IF flag_on_time && flag_off_time : flag_off_time - flag_on_time
ELSE IF flag_on_time : now() - flag_on_time
Time in status for a specific month
WITH year = 2023:
WITH month = 1: // 1 for Jan, 12 for Dec
WITH keyStatus = "in progress": // key-insensitive
WITH calendar = "Standard work calendar 8/5": // other option is Standard calendar 24/7, the value is locale-dependant, also Gantt calendars are available
WITH startDate = MAKE_DATE(year, month, 1):
WITH finishDate = MIN(DATE_ADD(startDate, 1, "month"), NOW()):
WITH isStart(change) = change.from != keyStatus AND change.to = keyStatus:
WITH isFinish(change) = change.from = keyStatus AND change.to != keyStatus:
WITH intervalFits(start, finish)
  =  start >= startDate AND start <= finishDate
  OR finish >= startDate AND finish <= finishDate
  OR start < startDate AND finish > finishDate:

WITH statusChanges = history.changes
  .FILTER($.field = "status" AND ($.isStart() OR $.isFinish())):
WITH times = MERGE_ARRAYS(
  IF statusChanges.FIRST().isFinish(): MIN(startDate, statusChanges.FIRST().changeGroup.time),
  statusChanges.changeGroup.time,
  IF statusChanges.LAST().isStart(): MAX(finishDate, statusChanges.LAST().changeGroup.time)
):

IF times: SEQUENCE(0, times.SIZE() - 1)
  .FILTER(MOD($, 2) == 0 AND intervalFits(times.GET($), times.GET($ + 1)))
  .MAP(CALENDAR_DURATION(MAX(times.GET($), startDate), MIN(times.GET($ + 1), finishDate), calendar))
  .SUM()
Issue Links and Subtasks
Show linked issues
Displays issues linked to the current issue.
issueLinks.MAP(IF($.source = this, $.destination, $.source))
Show issue links
Displays issue links containing the current issue. Ex. STR-006 → GANTT-002
issueLinks.MAP($.source.key CONCAT '→' CONCAT $.destination.key)
Show issues blocking the current issue
Displays issue links for all blockers.
WITH _format(issue) = """[${issue.key}|${issue.url}]""" :
issuelinks
  .FILTER($.type = 'Blocks' AND $.destination = this)
  .MAP(_format($.source))
Make sure to set the column Options to Wiki Markup.
Want to display another link type? Change: $.type = 'Blocks'
Check whether all blocking issues are resolved
Displays "OK" if all issues linked via the "Blocks" link type are marked as resolved.
IF issueLinks.FILTER($.type = "Blocks" AND $.destination = this).ALL($.source.resolution):
   "OK"
Show parent issue
Displays the parent issue of the current item, based on the "is parent of" link.
Depending on the direction of your parent links, select one of the following:
Outward parent links
issueLinks.FILTER($.type.outward = "is parent of" AND $.destination = this).MAP($.source.key CONCAT ' - ' CONCAT $.source.summary)
or
Inward parent links
issueLinks.FILTER($.type.inward = "is parent of" AND $.destination = this).MAP($.source.key CONCAT ' - ' CONCAT $.source.summary)
Show percent of subtasks that have been completed
IF subtasks.SIZE() > 0 :

    subtasks.FILTER($.status = ‘Done’).SIZE() / subtasks.SIZE()
Items and Properties
Access an item property
Use the following format: item.property
The following returns the release date for each fix version:
fixVersions.releaseDate
Note: if the fix version field contained multiple values, multiple dates will be returned.
For a list of accessible item types and their properties, see Item Property Reference.
Get a custom field value for this issue, its epic, or its sub-task
You can accomplish this in a few different ways:
this.storypoints   // Using item properties. Use a lowercased custom field name, with spaces skipped.
this.ACCESS("Story Points") // Using the ACCESS function. Write the custom field exactly as it appears in Jira (with spaces).
this.customfield_###### // Using the custom field's id.
See how many sprints an issue has been added to
sprint.size()
Find the highest subtask priority
subtasks.priority.UMAX()
Returns the highest priority of the subtasks.
Find the subtask with the highest priority
with highest_priority = subtasks.priority.UMAX(): subtasks.FILTER($.priority = highest_priority)
Returns all subtasks with the highest priority.
Compare two priorities
IF(priority1.sequence > priority2.sequence)
Predict the finish date for epics
IF issueType = epic :
  MAX(epicStories.sprint.endDate)
Returns the latest sprint end date for stories within each epic, even if those stories are not contained in the structure.
JQL and S-JQL
Show aggregate story points for a specific Jira user group
SUM {
  IF JQL { assignee in membersOf('Group A') } :
  storyPoints
}
Note: Replace 'Group A' with the name of the group you want to calculate for.
Want to aggregate another value? Just replace 'storyPoints' with the attribute you want to calculate.
Users
Show everyone who worked on the task
ARRAY(reporter, assignee, developer, tester)
Note: developer and tester are custom fields - they will be automatically mapped only if those custom fields exist in your Jira instance.
Show everyone who worked on any task in the subtree
VALUES { ARRAY(reporter, assignee, developer, tester) }
Note: developer and tester are custom fields - they will be automatically mapped only if those custom fields exist in your Jira instance.
Calculate who logged the most work
worklogs
  .GROUP($.author)
  .MAP(ARRAY($.group, $.elements.timespent.sum()))
  .UMAX_BY($.GET(1))
  .GET(0)
Get a detailed description of the tasks users spent time on
First, use an attribute grouper with the formula:
worklogs.author.UNIQUE()
Then, add a formula column:
IF itemType = 'user':
SUM#children {
  WITH user = PARENT { item } :
  worklogs
    .FILTER($.author = user)
    .timeSpent.SUM()
}
Versions
Check for a specific fix version
fixVersion.CONTAINS("v1")
If the issue contains that fixVersion, returns 1 (true). Otherwise, returns 0 (false).
Get the latest/earliest fix version
fixVersions.UMAX_BY($.releaseDate) // latest


fixVersions.UMIN_BY($.releaseDate) // earliest
Find the largest time span of an affected version
affectedVersions.MAP(IF $.releaseDate AND $.startDate: $.releaseDate - $.startDate).MAX()
For each Affected Version, subtracts the Start Date from the Release Date, and returns the Affected Version with the largest result.
Want the shortest result? Change MAX to MIN.
Show all versions referenced in the subtree
VALUES { ARRAY(fixVersions, affectedVersions).FLATTEN().UNIQUE() }
Get all fix versions with future release dates
fixVersions.FILTER($.releaseDate AND $.releaseDate > NOW())
Show all released affected versions
affectedVersions.FILTER($.isreleased)
Show all issues released during a set period of time
When used as a filter generator or transformation, the following code will show only issues that were part of fix versions released during Q1, 2021.
DATE(“0/Jan/2021”) < fixVersion.releaseDate

   AND fixVersion.releaseDate < DATE (“31/Mar/2021”)
Check that child issues and paret issues have the same Fixversion
with parentVersion = PARENT{FixVersion}:
  if(parentVersion and !parentVersion.contains(fixVersion); "version mismatch")
Wiki Markup
Wiki markup allows you to get creative and visualize more complex metrics in Structure columns, such as custom progress bars, bar charts and much more.
We've put together several advanced, customizable examples of wiki markup usage:
Display subtasks as links
subtasks.MAP("""[${$.key}|${$.url}]""")
Create a borderless background behind the value
WITH addBackground(value, color) =
  """{panel:bgColor=$color|borderWidth=0px}$value{panel}""":
addBackground(summary, "#ADFF2F")
Customizable Progress Bar
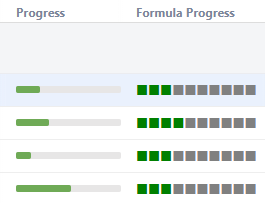
In this simple example, we used Wiki Markup to create a customized progress bar. In the left column you can see the built-in progress column. In the right one, we've built a progress bar which is split into 10% sections.

We used the following formula to build the custom progress bar:
Simple progress bar
WITH simpleProgressBar(progress, maxProgress, stepCount) = (
  WITH _bars(count, color) = """{color:$color}${REPEAT("■", count)}{color}""":
  WITH doneBarsCount = FLOOR(progress / maxProgress * stepCount):
  _bars(doneBarsCount, "green") CONCAT _bars(stepCount - doneBarsCount, "gray")
):

simpleProgressBar(customProgress, 1, 10)
Starting with this, you can tailor the progress bar to your team's particular needs.
-
Colors can easily be configured by altering the "color" values - in this case, we used green and gray squares.
-
The progress calculation can be based on any percentage value. In the following example, we used an arbitrary percentage field and aggregated up the hierarchy.
-
In simpleProgressBar(customProgress, 1, 10), the '1' is the maximum possible progress value:
-
If you’re using progress values between 0 and 1, keep 1
-
If you’re using progress values between 1 and 100, change this to 100
-
Simple progress bar
WITH simpleProgressBar(progress, maxProgress, stepCount) = (
  WITH _bars(count, color) = """{color:$color}${REPEAT("■", count)}{color}""":
  WITH doneBarsCount = FLOOR(progress / maxProgress * stepCount):
  _bars(doneBarsCount, "green") CONCAT _bars(stepCount - doneBarsCount, "gray")
):

simpleProgressBar(SUM { progressField }, SUM { 1 }, 10)
This can be especially useful if you want to display progress based on some complex fields, like a ScriptRunner scripted field, which is not supported by the standard formula column at the moment.
Customizable Status Bars
Wiki markup can also be used to create more complex progress calculations, based on multiple issue statuses.
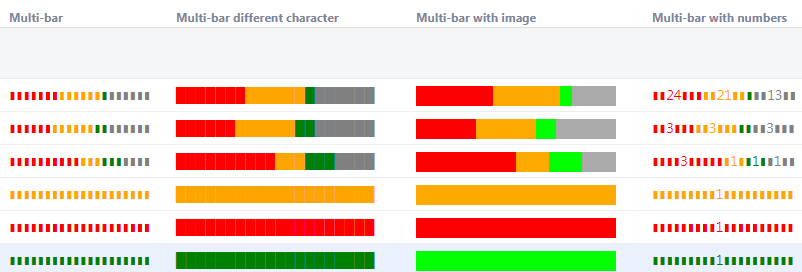
In the following example, we created multiple custom status bars, tracking the following statuses:
-
To Do = Red
-
In Progress = Orange
-
Done = Green
-
All Other Statuses = Gray

As with our custom progress bar, these formulas can easily be modified to adjust status colors, include additional statuses or represent each status in a different format.
Multi-bar
We used the following code to build the Multi-bar Status Bar.
Multi-tiered progress bar
//stepCount - length of the bar chart in characters
WITH multiProgressBar(progressArray, maxProgress, colorsArray, colorForRemaining, stepCount) = (
  WITH _bars(count, color) = (IF count > 0: """{color:$color}${REPEAT("▮", count)}{color}""" ELSE ""):
  WITH barCounts = progressArray.MAP(FLOOR($ / maxProgress * stepCount)):
  progressArray.INDEXES()
    .MAP(_bars(barCounts.GET($), colorsArray.GET($)))
    .MERGE_ARRAYS(_bars(MAX(0, stepCount - barCounts.SUM()), colorForRemaining))
    .JOIN("", "", "")
):

WITH todo = COUNT#truthy { status = "To Do" }:
WITH inProgress = COUNT#truthy { status = "In Progress" }:
WITH done = COUNT#truthy { status = "Done" }:

multiProgressBar(
  ARRAY(todo, inProgress, done), COUNT { 1 },
  ARRAY("red", "orange", "green"), "gray",
  20
)
You can change the appearance of the status simply by altering the granularity (length of the bar sections) or a using a larger symbol as we did in the Multi-bar different character example.
While the ■ or ▮ symbols may lack solid feel, the █ symbol still creates a slight brick-layer effect.
Multi-bar with Image
In this example, we used a simple, monochrome images (a 1x1 pixel size is enough) to make the status bar appear more solid. If you decide to try this, we highly recommend using a locally-hosted image, rather than one taken from public sources, because some hosts may block multiple successive requests for an image.
Multi-tiered progress bar based on images
//Granularity - length of the bar chart in pixels
WITH multiProgressBarWithImage(progressArray, maxProgress, imagesArray, imageForRemaining, granularity) = (
  WITH bar(width, image) = (IF width > 0: """!$image|height=20,width=$width!""" ELSE ""):
  WITH barCounts = progressArray.MAP(FLOOR($ / maxProgress * granularity)):
  progressArray.INDEXES()
    .MAP(bar(barCounts.GET($), imagesArray.GET($)))
    .MERGE_ARRAYS(bar(MAX(0, granularity - barCounts.SUM()), imageForRemaining))
    .JOIN("", "", "")
):


WITH todo = COUNT#truthy {status = "to do"}:
WITH inProgress = COUNT#truthy {status = "in progress"}:
WITH done = COUNT#truthy {status = "done"}:

WITH link(name) = """https://www.example.com/images/$name.png""":

multiProgressBarWithImage(
  ARRAY(todo, inProgress, done), COUNT{1},
  ARRAY("Red", "Orange", "Green").MAP(link), link("Gray"),
  200
)
Multi-bar with Numbers
In this last example, the status bar displays an issue count for each status, when the bar width permits. This code could be easily customized to display either the actual number of issues or their percentage.
Progress bar with numbers
//Parameters: granularity - length of bar-chart in characters; bar - filler of the bar chart
WITH multiProgressBarWithNumbers(progressArray, maxProgress, colorsArray, colorForRemaining, granularity, bar) = (
  WITH bars(count, value, color) = (
    IF count <= 0:
      ""
    ELSE:
      WITH bars = (
        WITH charsForValue = LEN(value):
        IF count >= charsForValue + 2:
          WITH charsBeforeValue = FLOOR((count - charsForValue) / 2):
          REPEAT(bar, charsBeforeValue)
          CONCAT value
          CONCAT REPEAT(bar, count - charsBeforeValue - charsForValue)
        ELSE:
          REPEAT(bar, count)
      ):
	  """{color:$color}$bars{color}"""
  ):
  WITH barCounts = progressArray.MAP(FLOOR($ / maxProgress * granularity)):
  progressArray.INDEXES()
    .MAP(bars(barCounts.GET($), progressArray.GET($), colorsArray.GET($)))
    .MERGE_ARRAYS(bars(MAX(0, granularity - barCounts.SUM()), MAX(0, maxProgress - progressArray.SUM()), colorForRemaining))
    .JOIN("", "", "")
):

WITH todo = COUNT#truthy {status = "to do"}:
WITH inProgress = COUNT#truthy {status = "in progress"}:
WITH done = COUNT#truthy {status = "done"}:

multiProgressBarWithNumbers(
  ARRAY(todo, inProgress, done), COUNT{1},
  ARRAY("red", "orange", "green"), "gray",
  20, "▮"
)
Simple Burn-down Chart
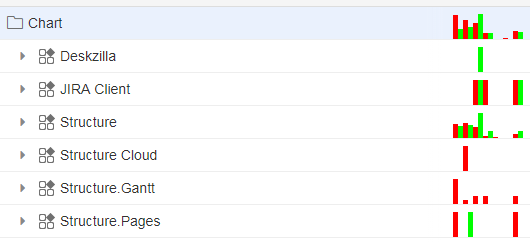
You can get even more creative and use wiki markup to build mini-charts – including this simple burn-down chart. In this example, our chart displays created issues in red and resolved issues in green, with each pair corresponding to one day in a week.

Due to space limitations, there is a height limit of 20 pixels imposed within the chart, but this is more than enough to create a simple, powerful visualization.
Burn-down chart
WITH dataArray = ARRAY(
  COUNT#truthy {DATE_SUBTRACT(NOW(),6,"days") <= created  and DATE_SUBTRACT(NOW(),5,"days") > created},
  COUNT#truthy {DATE_SUBTRACT(NOW(),6,"days") <= resolved and DATE_SUBTRACT(NOW(),5,"days") > resolved},
  COUNT#truthy {DATE_SUBTRACT(NOW(),5,"days") <= created  and DATE_SUBTRACT(NOW(),4,"days") > created},
  COUNT#truthy {DATE_SUBTRACT(NOW(),5,"days") <= resolved and DATE_SUBTRACT(NOW(),4,"days") > resolved},
  COUNT#truthy {DATE_SUBTRACT(NOW(),4,"days") <= created  and DATE_SUBTRACT(NOW(),3,"days") > created},
  COUNT#truthy {DATE_SUBTRACT(NOW(),4,"days") <= resolved and DATE_SUBTRACT(NOW(),3,"days") > resolved},
  COUNT#truthy {DATE_SUBTRACT(NOW(),3,"days") <= created  and DATE_SUBTRACT(NOW(),2,"days") > created},
  COUNT#truthy {DATE_SUBTRACT(NOW(),3,"days") <= resolved and DATE_SUBTRACT(NOW(),2,"days") > resolved},
  COUNT#truthy {DATE_SUBTRACT(NOW(),2,"days") <= created  and DATE_SUBTRACT(NOW(),1,"days") > created},
  COUNT#truthy {DATE_SUBTRACT(NOW(),2,"days") <= resolved and DATE_SUBTRACT(NOW(),1,"days") > resolved},
  COUNT#truthy {DATE_SUBTRACT(NOW(),1,"days") <= created  and DATE_SUBTRACT(NOW(),8,"hours") > created},
  COUNT#truthy {DATE_SUBTRACT(NOW(),1,"days") <= resolved and DATE_SUBTRACT(NOW(),8,"hours") > resolved},
  COUNT#truthy {DATE_SUBTRACT(NOW(),8,"hours") <= created},
  COUNT#truthy {DATE_SUBTRACT(NOW(),8,"hours") <= resolved}
):


//25 is maximum working height
WITH maxHeight = 25:
WITH maxValue = dataArray.MAX():
WITH getPicture(index) = (IF index.MOD(2) == 0: "https://www.example.com/images/Red.png" ELSE: "https://www.example.com/images/Green.png"):
WITH getHeight(index) = IF maxValue : FLOOR(dataArray.GET(index) / maxValue * maxHeight) ELSE : 0 :

IF itemtype != "issue":
dataArray
  .INDEXES()
  .MAP("""!${getPicture($)}|height=${getHeight($)},width=5!""")
  .JOIN("", "", "")
The criteria for issue inclusion can be easily customized to your team's needs. As mentioned above, we recommend hosting image files locally.
