Dashboards help you visualize work and track project metrics. Dashboards update in real time as people log progress, estimate assignments, edit data fields, and mark work done.
There are three types of Dashboards in Portfolio Manager. The Dashboard type defines its scope:
-
Workspace Dashboards incorporate data from all projects and packages.
-
Package Dashboards bring data together across all projects within a package.
-
Project Dashboards capture data from a single project.
Workspace, Package, and Project Dashboards are available in the Library, via the left-hand navigation. Package and Project Dashboards can also be accessed within a Package or Project.
|
1 |
Create Dashboards
|
Go to Library in the left-side navigation to view or create Dashboards. To create a new dashboard, click +Dashboard at the top of the window.
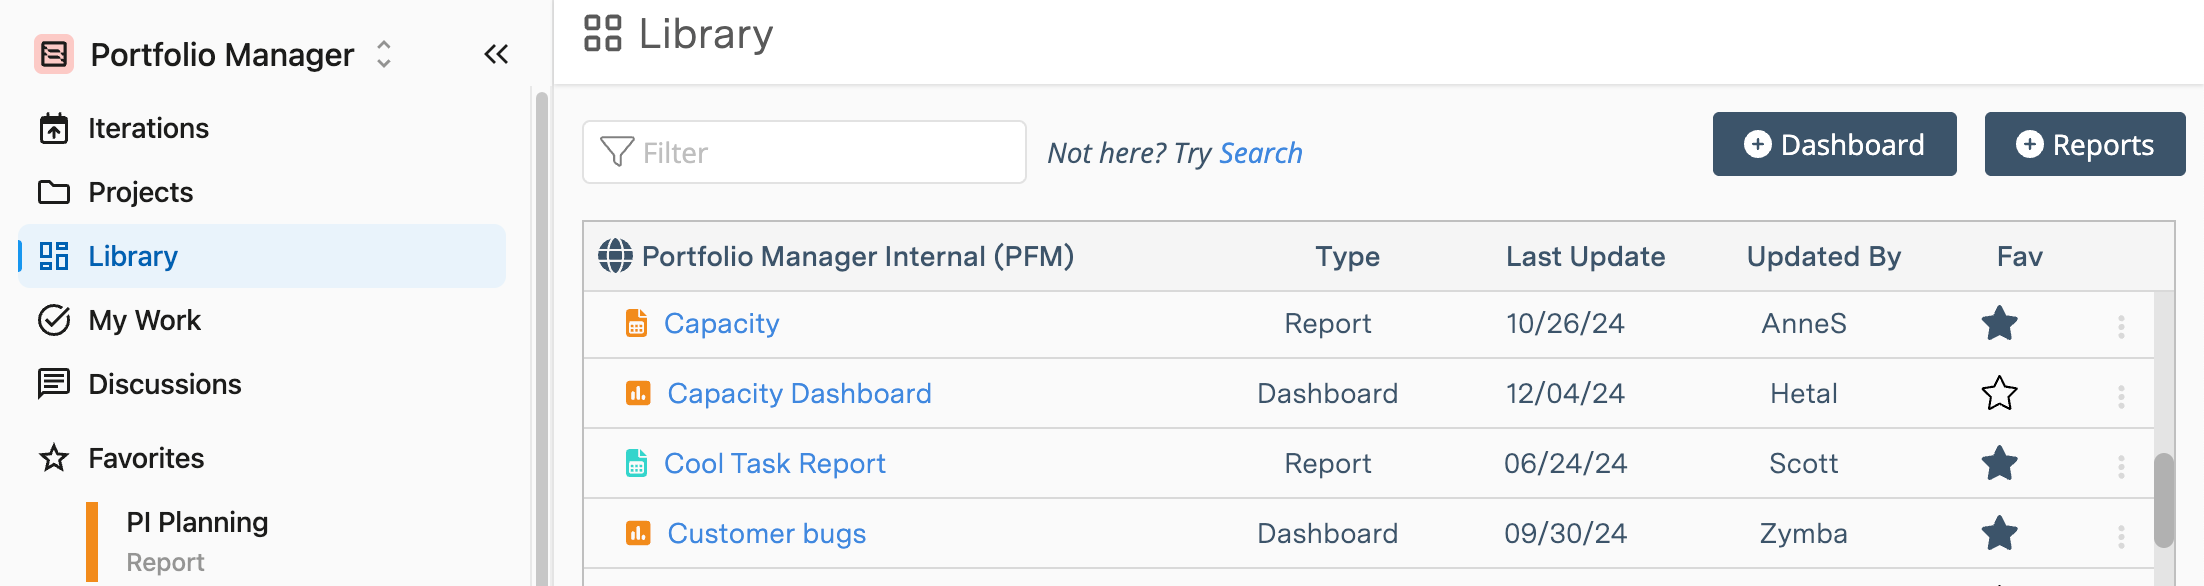
When you create a new dashboard from the Library, it will contain sample widgets and groups that can be customized to suit your needs. Click the Design button to customize the dashboard’s widgets, groups, and scope.
You need Project Manager access or higher to create Dashboards.
Project Observer access or higher is required to see Dashboards and plan items in the Dashboard Library.
|
2 |
Interact with Data in View Mode
|
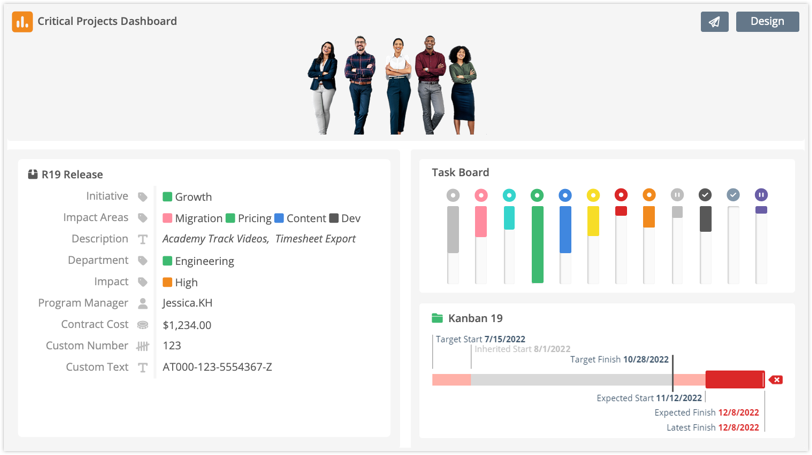
View Mode is the Dashboard’s front facing view. People land here when they click on a link to access the Dashboard.
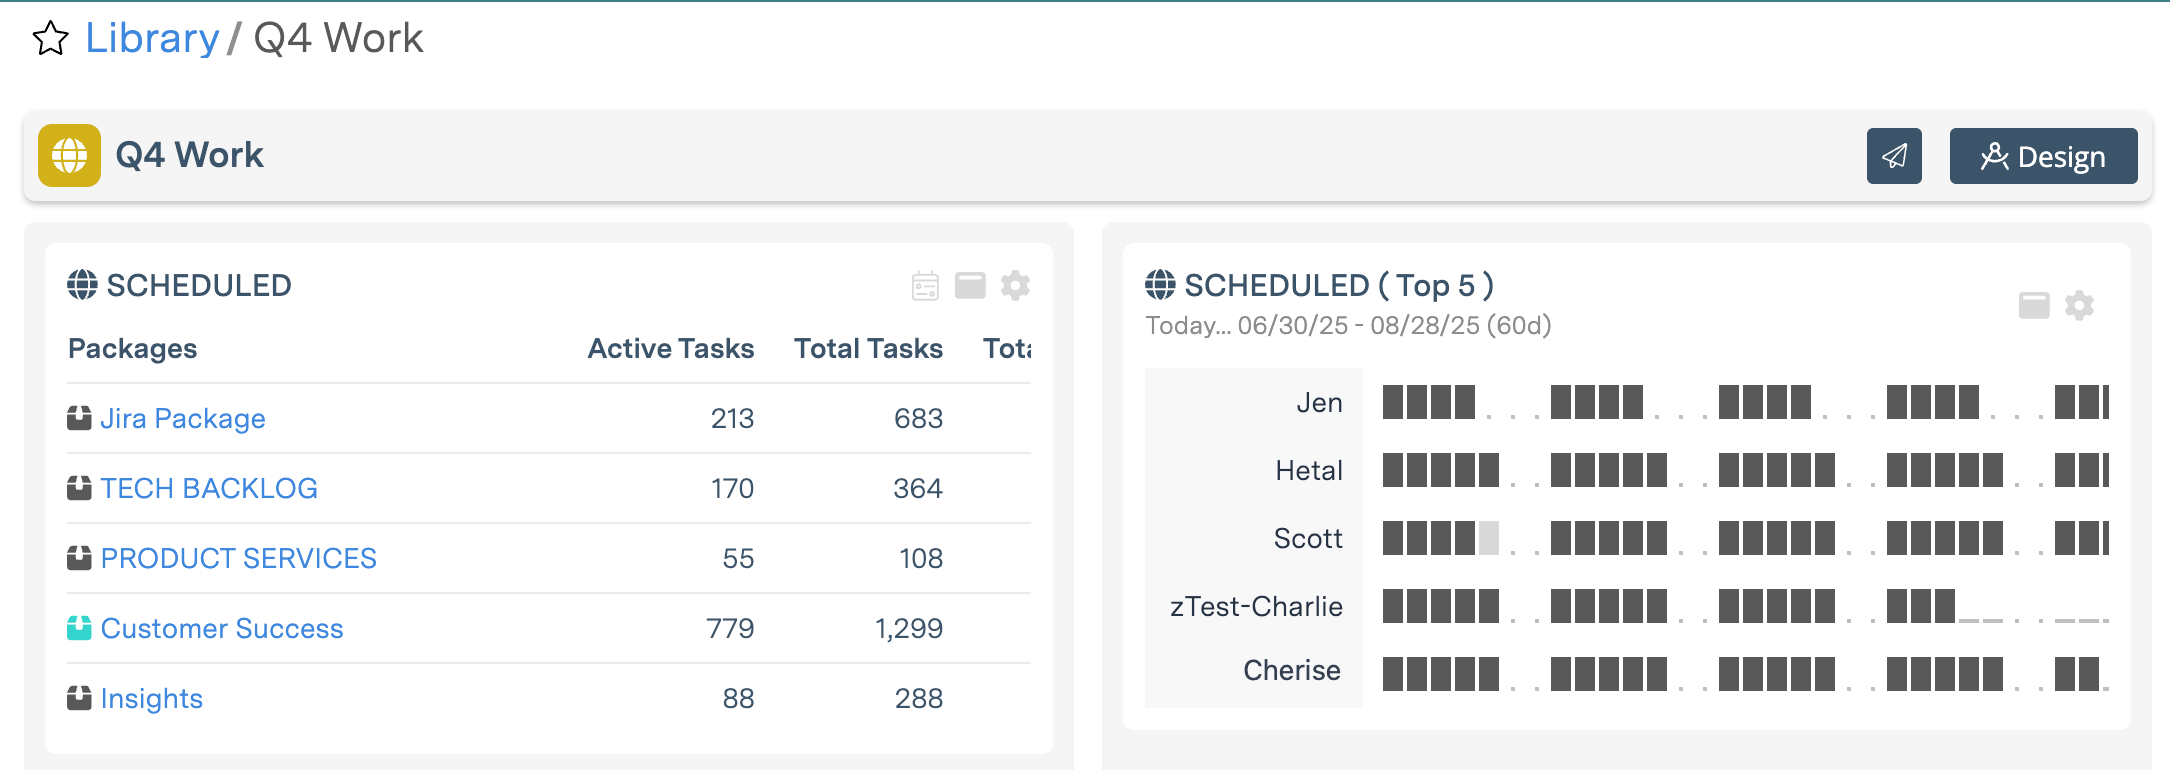
Widgets display data based on the scope, settings and filters established in the Dashboard’s design. Widgets are interactive in View Mode: they have settings enabling viewers to update plan items, access a more detailed view or navigate to another workspace location.
The title bar at the top of a Dashboard has two buttons:
-
Use Copy Link to share the dashboard with workspace members.
-
Design allows you to update the dashboard layout, settings, scope, and filters. Project Manager access or higher is required for Design Mode. The button is disabled when you don’t have sufficient access.
Click on the star at the top of a Dashboard to Favorite it for easy access from the left-side navigation.
|
3 |
Establish the Layout with Groups and Widgets in Design Mode
|
To edit the dashboard layout, click Design. This will open Design Mode, where you can customize the layout with Groups and Widgets.
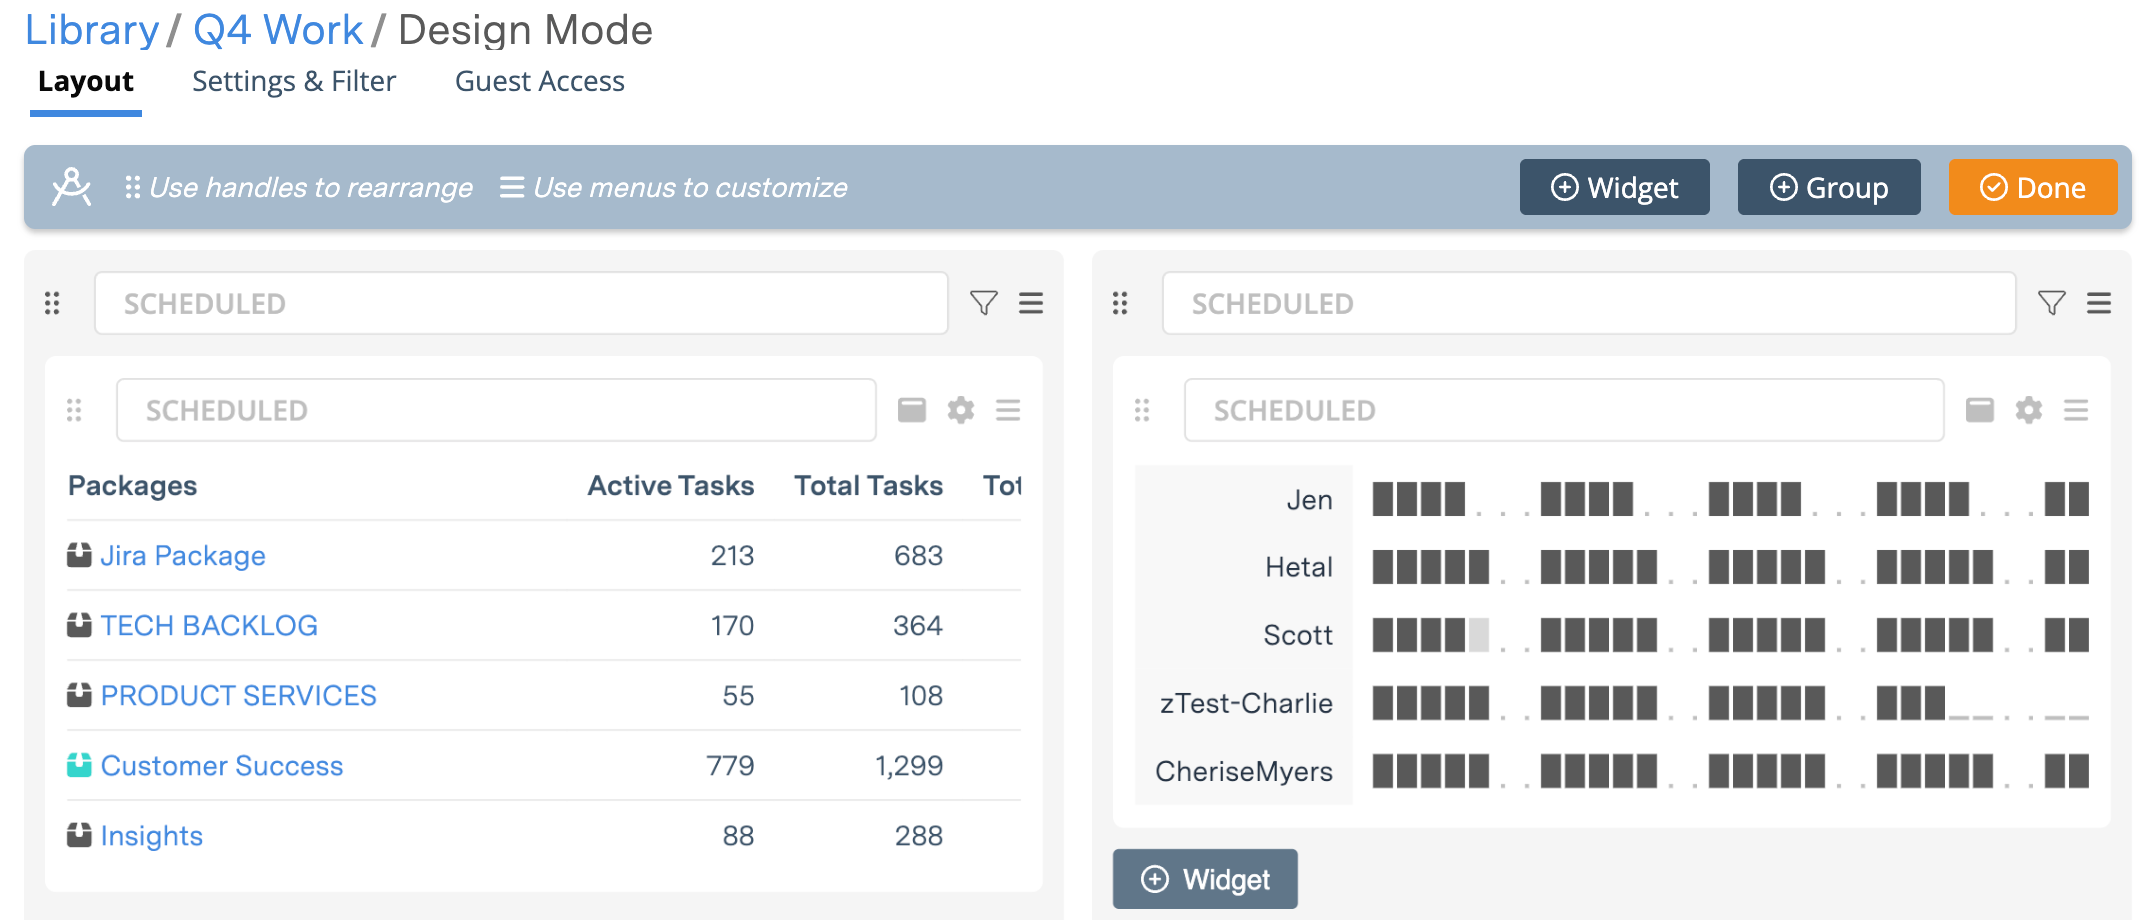
-
Widgets are the primary design element. Click +Widget to open the Widget Gallery. Select a widget, save it to the Dashboard, and then open the widget Settings to customize the name, scope, and filters. Widgets are always within a Group.
-
Groups create the Dashboard structure. Click +Group to create a new section in the Dashboard. Widgets can be created within the Group or dragged over from other Groups. Widgets inherit the Group’s scope and data filter settings. When widgets move from one group to the next, they automatically update to the new Group’s settings.
Widgets and Groups can be created, resized, rearranged, customized, and filtered to suit your needs. When you’re finished, select Done to close Design Mode.
|
4 |
Apply a Header and Image to Your Dashboard in Settings
|
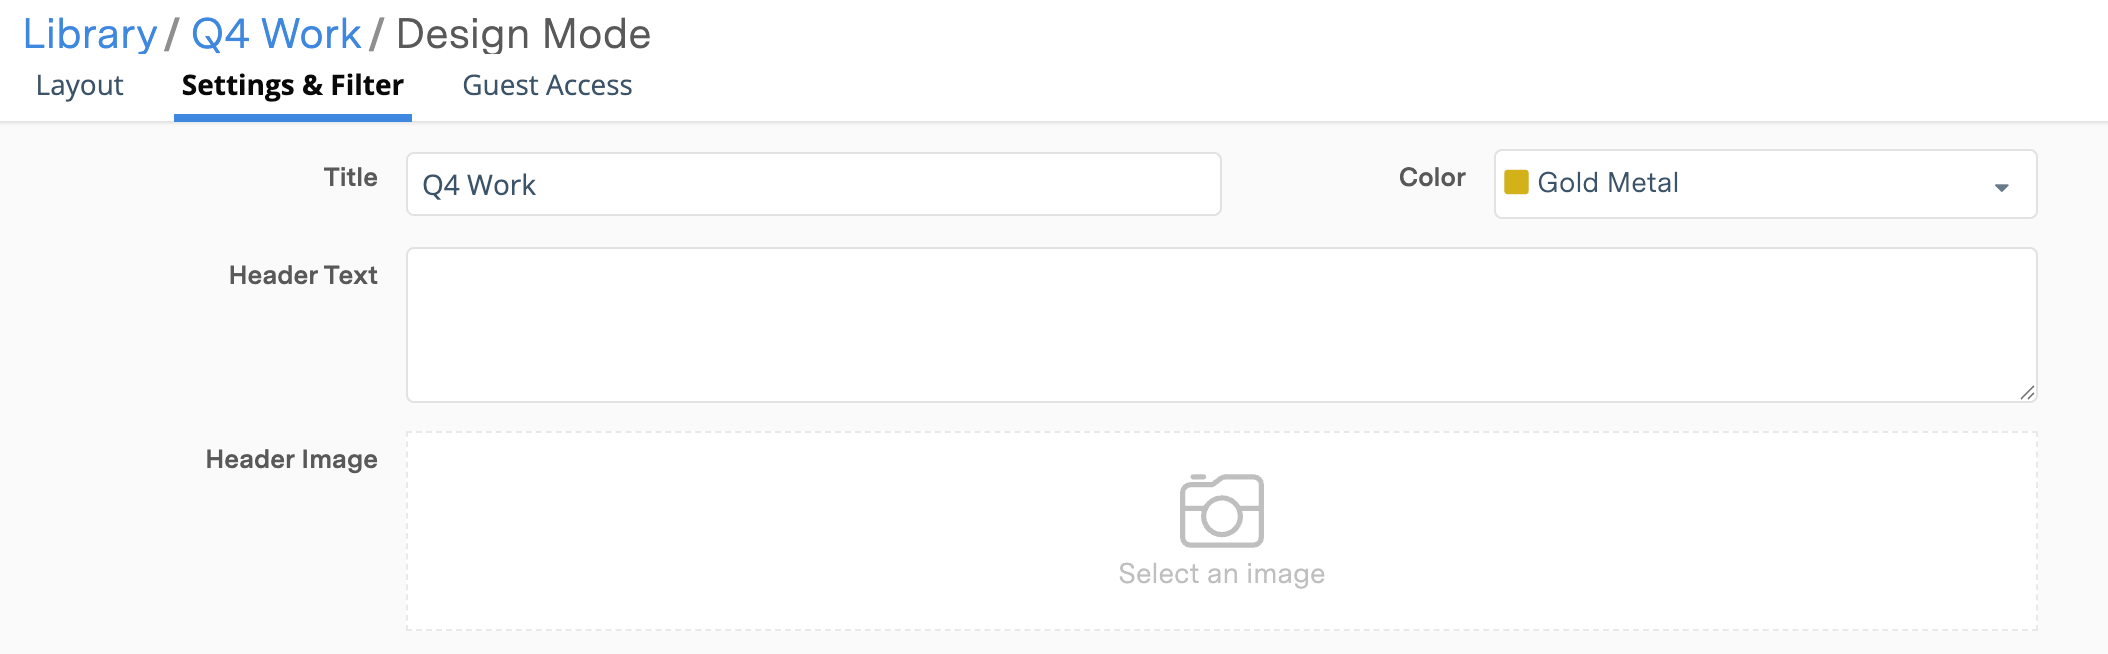
Under the Settings & Filter tab there are optional fields for adding Header Text and a Header Image for your Dashboard. A Workspace Dashboard also has title and color fields. Project and Package Dashboards carry the plan item name which can’t be edited in the Dashboard.
Click into the Header Image field to select, update or remove an image. Accepted file types include BMP, GIF, ICO, JPEG, PNG, SVG, TIFF, WEBP. The Save button commits our changes and exits Design Mode.
|
5 |
Scope and Filter to Capture What You Need
|
Filtering allows you to limit a dashboard’s contents based on Scope, Project, Task, Assignment, and Date Range.
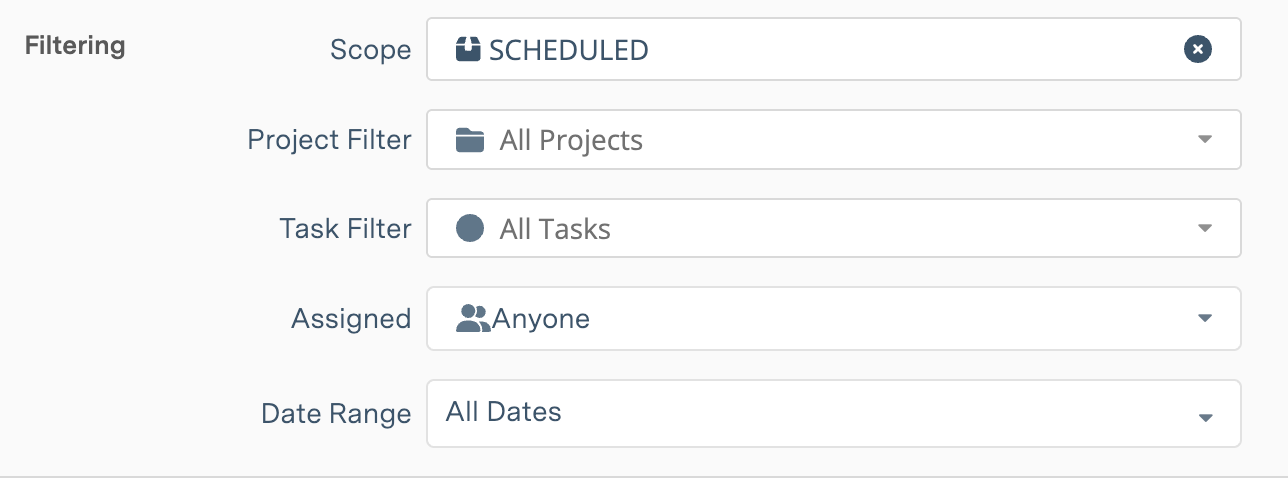
To filter your dashboard, open the Settings & Filter tab and locate the Filtering section.
Scope sets the Dashboard’s boundaries. In order for data to display on a Dashboard, it must be within the Dashboard Scope.
-
In a Project Dashboard, scope is the Project, and all of the data in the dashboard comes from Members, Resources, Work, and Properties within the Project. Groups and Widgets can be scoped to Sub-Folders within the Project.
-
Scope for a Package Dashboard is the Package, which means that it includes data from Projects within the Package. Groups and Widgets in a Package Dashboard can be scoped to specific Projects and Sub-Folders.
-
Workspace Dashboards have the broadest scope because they can incorporate data from across the workspace. This provides great flexibility because Groups and Widgets can be scoped to different Collections, Packages, Projects, and Sub-Folders.
Groups and Widgets inherit the Dashboard’s scope and filter settings.
Read more about Scope and Filtering. . .
![]()
Filtering occurs within the Dashboard Scope.
Use the Project and Task Filters to view information by schedule state (active, on hold, done), by Schedule Risk or Create a Custom filter to combine status filters with other properties such as Schedule Risk, Name Contains, Created By and Custom Data Fields.
The Assigned filter can be applied to Anyone or limited to display information related to a single Member, Resource or Placeholder. Workspaces on the ULTIMATE Plan can also filter by Group.
TIP: Filtering uses AND logic to identify items that meet all the Scope and Filter criteria. We recommend applying the broadest settings on the Dashboard and narrowing them down on the Group and Widget.