Package Dashboards can be accessed from within a Package or through the Library. To access from a Package, go to Projects in the left-side navigation, select a Package, and open its Library. To access via the Library, go to Library in the left-side navigation. Package Dashboards can be created in any Collection: SCHEDULED, PENDING, ARCHIVED, and TEMPLATES.
|
1 |
Monitor Data Across Projects with Package Dashboards
|
Package Dashboards bring together data across all projects within a Package.
Project Managers can create Package Dashboards by opening a package, selecting the Library tab, and clicking +Dashboard. Once created, they can customize the dashboard in Design Mode. Everyone with access to the Package sees the same widgets and data.
This lesson covers Package Dashboards. If you’re interested in tracking a single project, use a Project Dashboard instead. There are also Workspace Dashboards for monitoring projects from multiple Packages and Collections.
See the Dashboards to learn about components that are common across all Dashboards: View Mode, Design Mode, Layout, Widgets, Widget Groups, Settings, Scope, and Filtering.
|
2 |
Package Dashboard Scope & Filtering
|
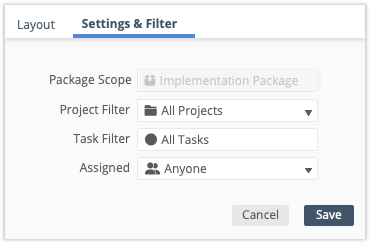
Scope sets the Dashboard’s boundaries. In a Package Dashboard, scope is the Package, and all the data in the dashboard comes from Members, Resources, Schedule Data, Work, and Properties from Projects in the Package. Package Dashboard scope can’t be edited, but Groups and Widgets can be scoped to the Package’s Projects and Sub-Folders.
![]()
Filtering occurs within the Dashboard Scope. Setting Dashboard Filters is optional. Groups and Widgets inherit the Dashboard Scope and Filters.
|
3 |
Sample Groups & Widgets on the Package Dashboard
|
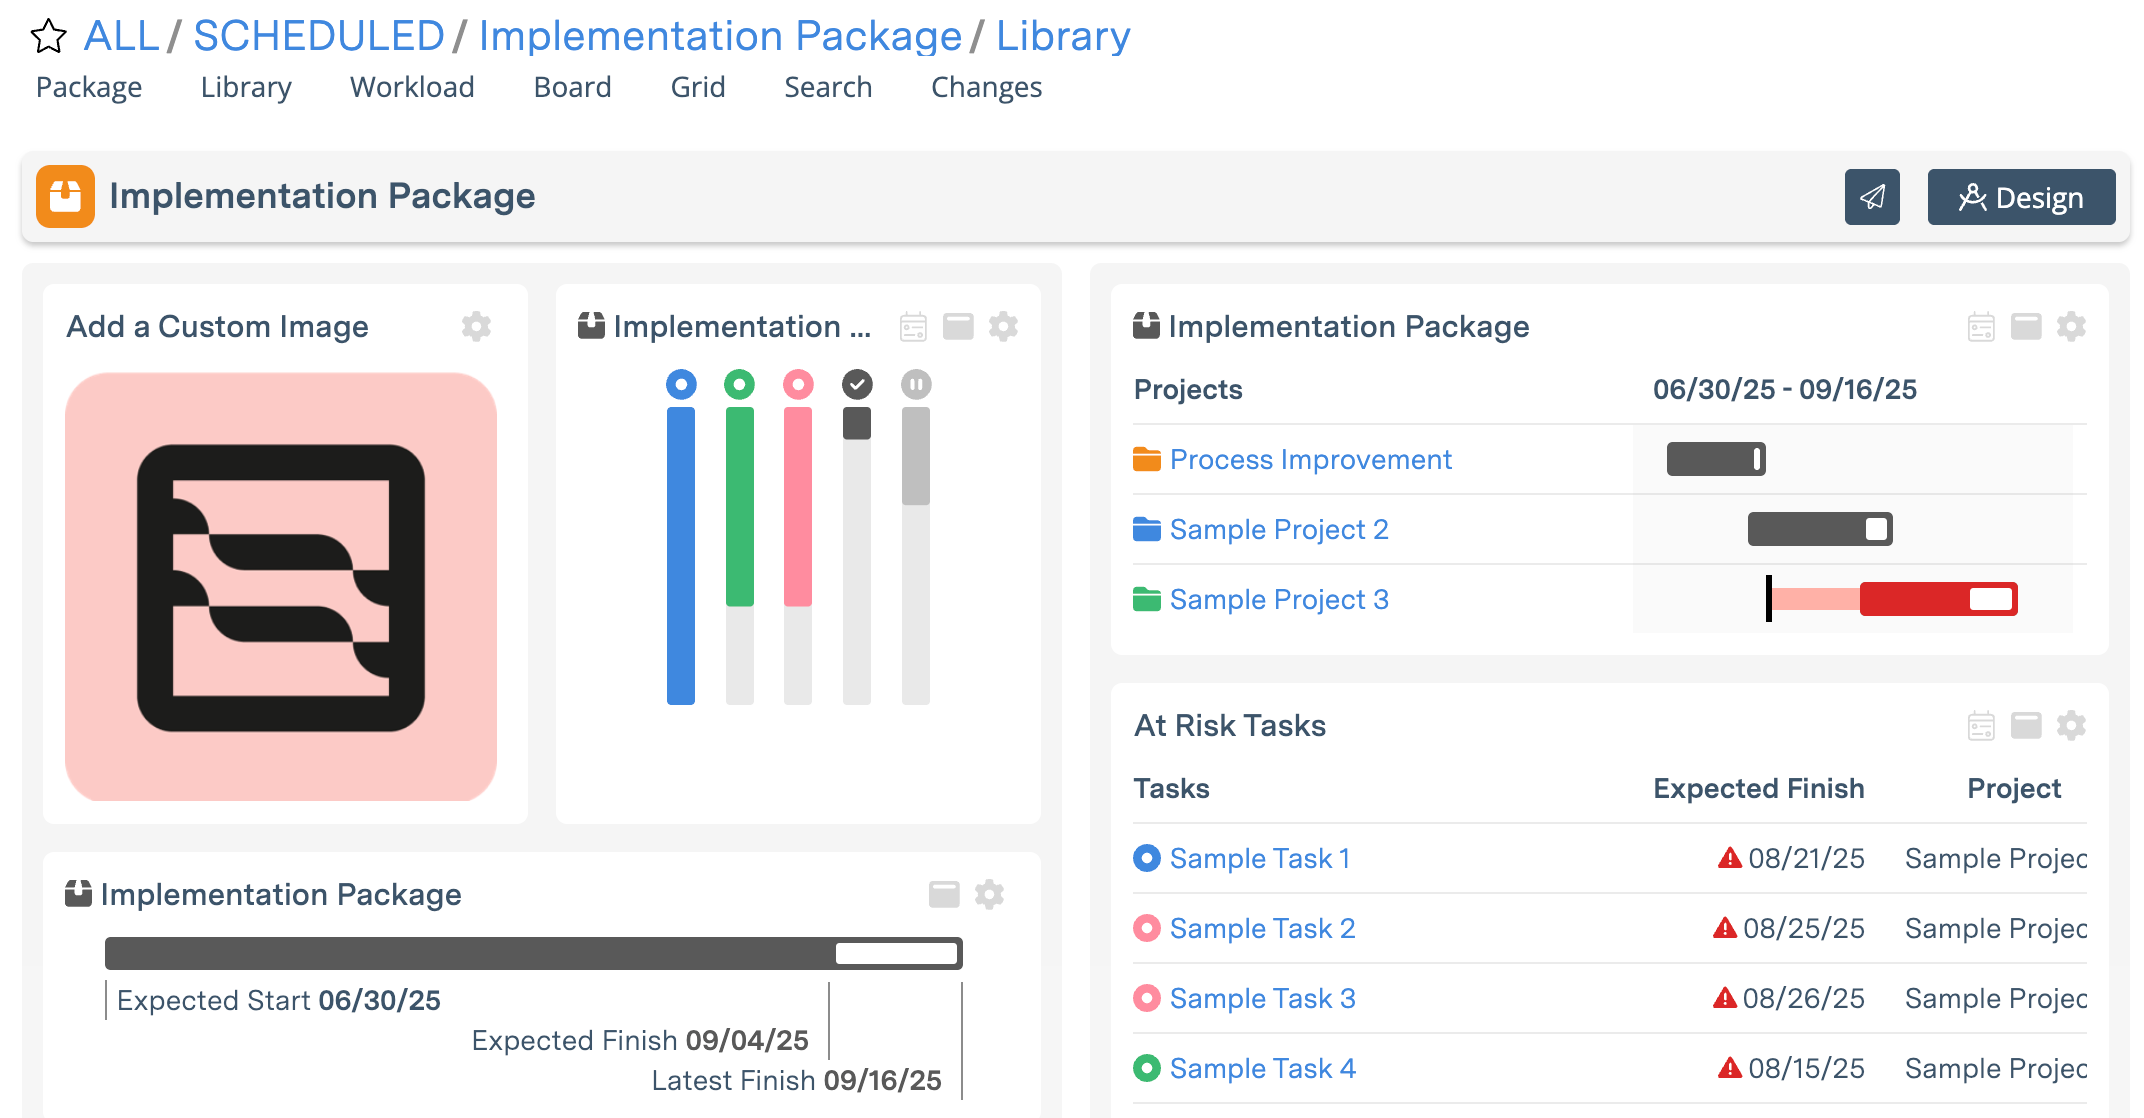
A Package Dashboard starts out with twelve Widgets in two Groups. Seven widget types are represented: Image, Task Board, Schedule Summary, Workload, Metrics Tally, Project List, Task List, Changes.
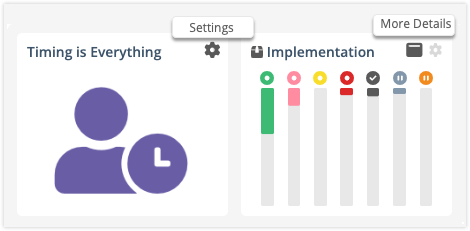
Clicking More Details on the Widget performs a specific action defined in its Settings: it can expand into a View on the Dashboard, open a Plan Item Edit Panel, or navigate to another View in the Workspace.
Project Managers can use Settings to edit widgets without leaving View Mode. For more extensive customization, click Design at the top of the dashboard to enter Design Mode. Here are some things to try:
-
Scope Groups or Widgets to Projects and Sub-Folders.
-
Apply Filters to Groups and to the Widgets that have Data Filter Settings.
-
Change what happens when More Details is clicked on Widgets that have On-Click Settings.
-
Adjust the Layout by dragging Widgets and Groups to new locations on the Dashboard.
-
Add more Widgets and Groups, or Duplicate existing ones and change the scope and filters.
|
4 |
Filtering Groups and Widgets on the Package Dashboard
|
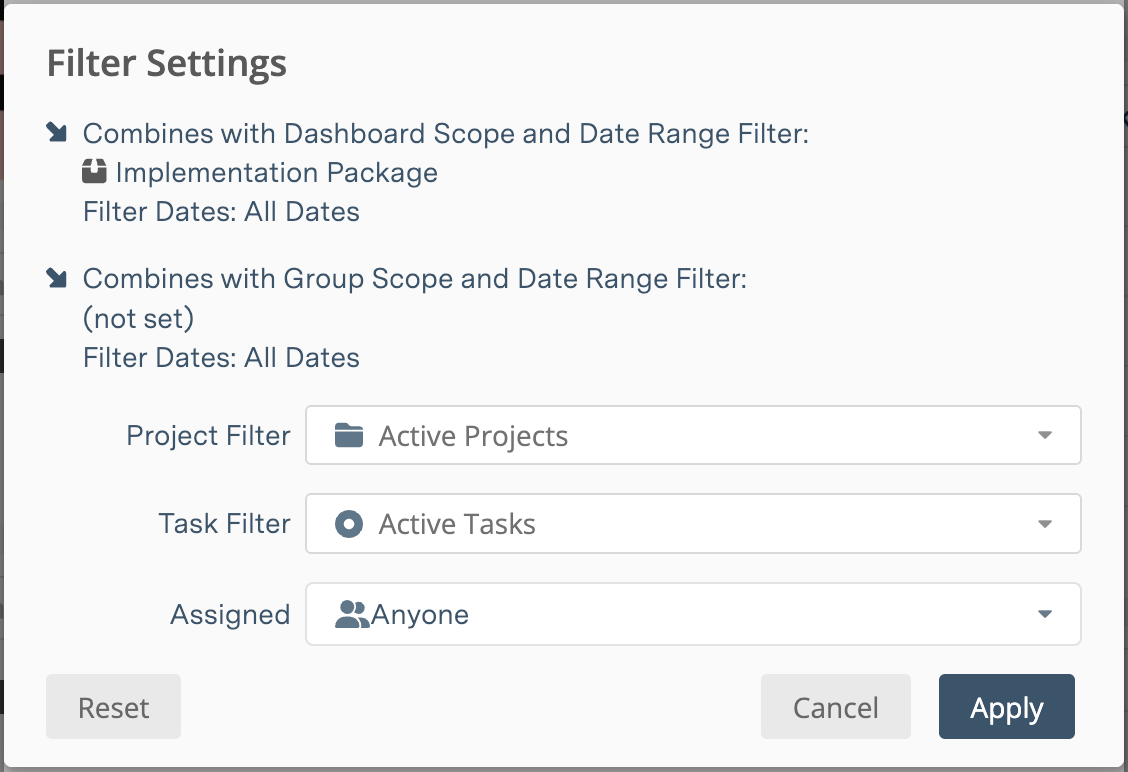
Filtering uses AND logic to identify items that meet all the Scope and Filter criteria. We recommend applying the broadest settings on the Dashboard and narrowing them down on the Group and Widget. Filtering the Dashboard is optional.
-
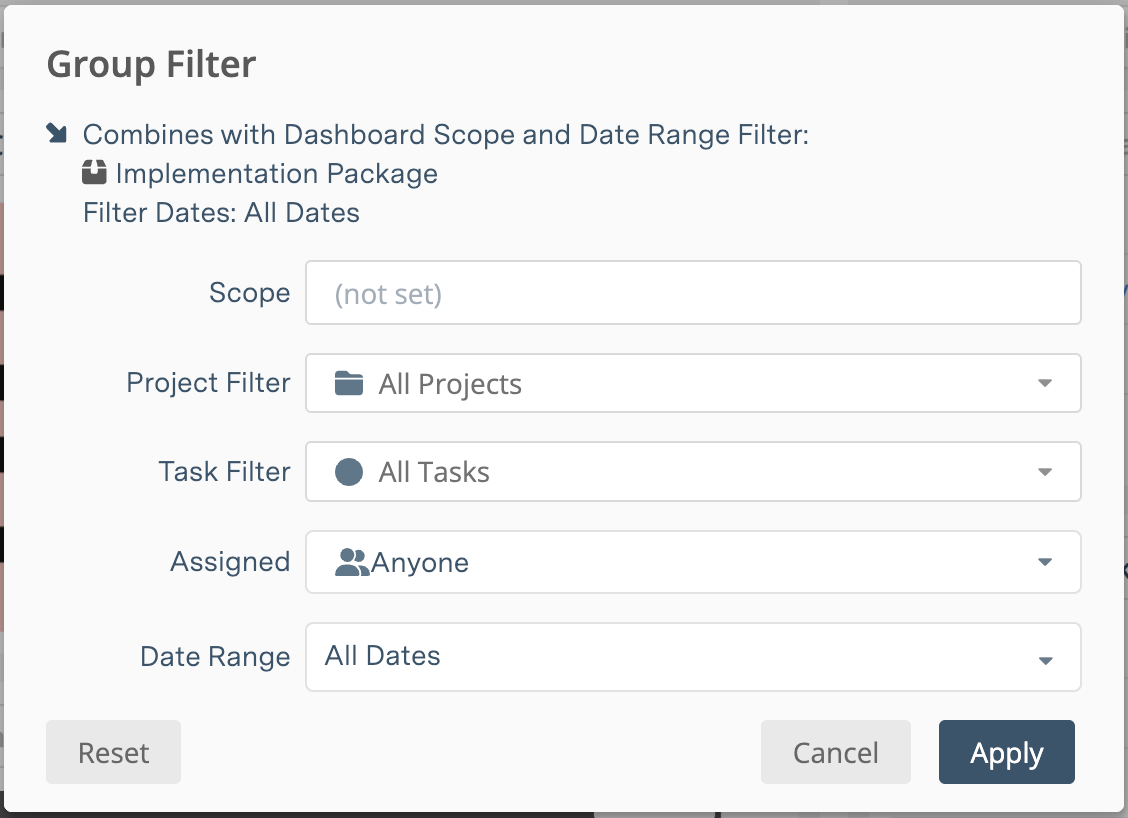
Group Filters are set in Design Mode. Use the filter icon in the Group header to open the filter modal.
-
For widgets, select Settings and then under the Data section, select Filter Settings. This can be done from View Mode or Design Mode.
List Widgets, Metrics Tally, Task Board, and Workload widgets have Data Filter Settings. Learn more in the Widgets & Groups article.
See an example of Group and Widget filtering…
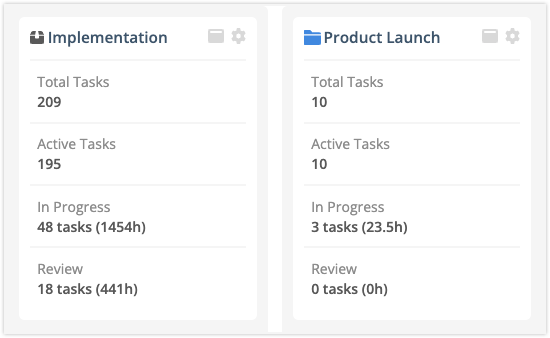
In the example above, the Metrics Tally widget on the left shows data for the Implementation Package, which includes information from all the projects in the package. The Group and the Widget don’t have any scope or filters applied so they inherit Package Dashboard settings:
Dashboard Scope = Package
Dashboard filters = All Projects, All Tasks, Assigned to Anyone
The Metrics Tally widget on the right shows how the data changes when scope is applied to a Group and filters are added to the Group and Widget settings.
Group Scope = Product Launch Project
Group Task Filter = Active Tasks
Widget Filter = Custom Task Filter for Name Contains “QA”.
Interpreting the widget results, there are a total of 10 Active Tasks in the Product Launch project with QA in the Task Name. Three have the Custom Task Status, “In Progress” and none of them have Custom Task Status, “Review.”