Project Dashboards can be accessed from within a Project or through the Library. To access from a Project, go to Projects in the left-side navigation, select a Project, and open its Library. To access via the Library, go to Library in the left-side navigation. Project Dashboards can be created in any Collection: SCHEDULED, PENDING, ARCHIVED and TEMPLATES.
|
1 |
Every Project has a Dashboard
|
A Project Dashboard is automatically created with sample Widgets and Groups the first time a Project Manager accesses it. After that, they can customize it in Design Mode. Everyone with access to the Project sees the same widgets and data.
This lesson covers Project Dashboards, which capture data from a single project. To capture work across multiple projects, use Workspace Dashboards or Package Dashboards.
See the Dashboards to learn about components that are common across all Dashboards: View Mode, Design Mode, Layout, Widgets, Widget Groups, Settings, Scope, and Filtering.
|
2 |
Project Dashboard Scope & Filtering
|
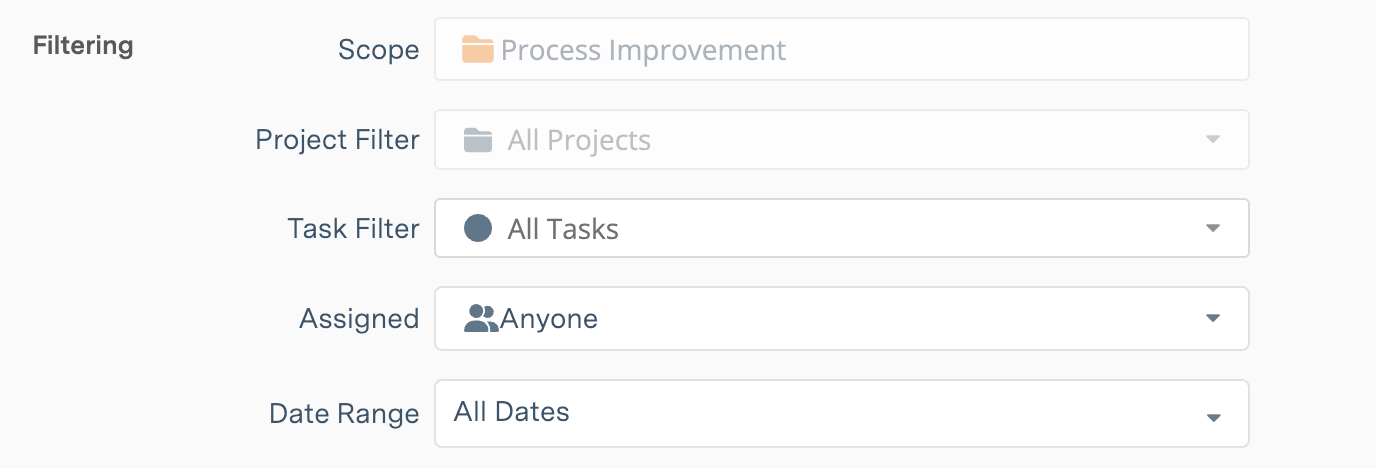
Scope sets the Dashboard’s boundaries. In a Project Dashboard, scope is the Project, and all the data in the dashboard comes from Members, Resources, Schedule Data, Work, and Properties within the Project. Project Dashboard scope can’t be edited, but Groups and Widgets can be scoped to Sub-Folders within the Project.
![]()
Filtering occurs within the Dashboard Scope. Setting Dashboard Filters is optional. Groups and Widgets inherit the Dashboard Scope and Filters.
Scope and Filtering are located under Settings & Filter in Design Mode.
|
3 |
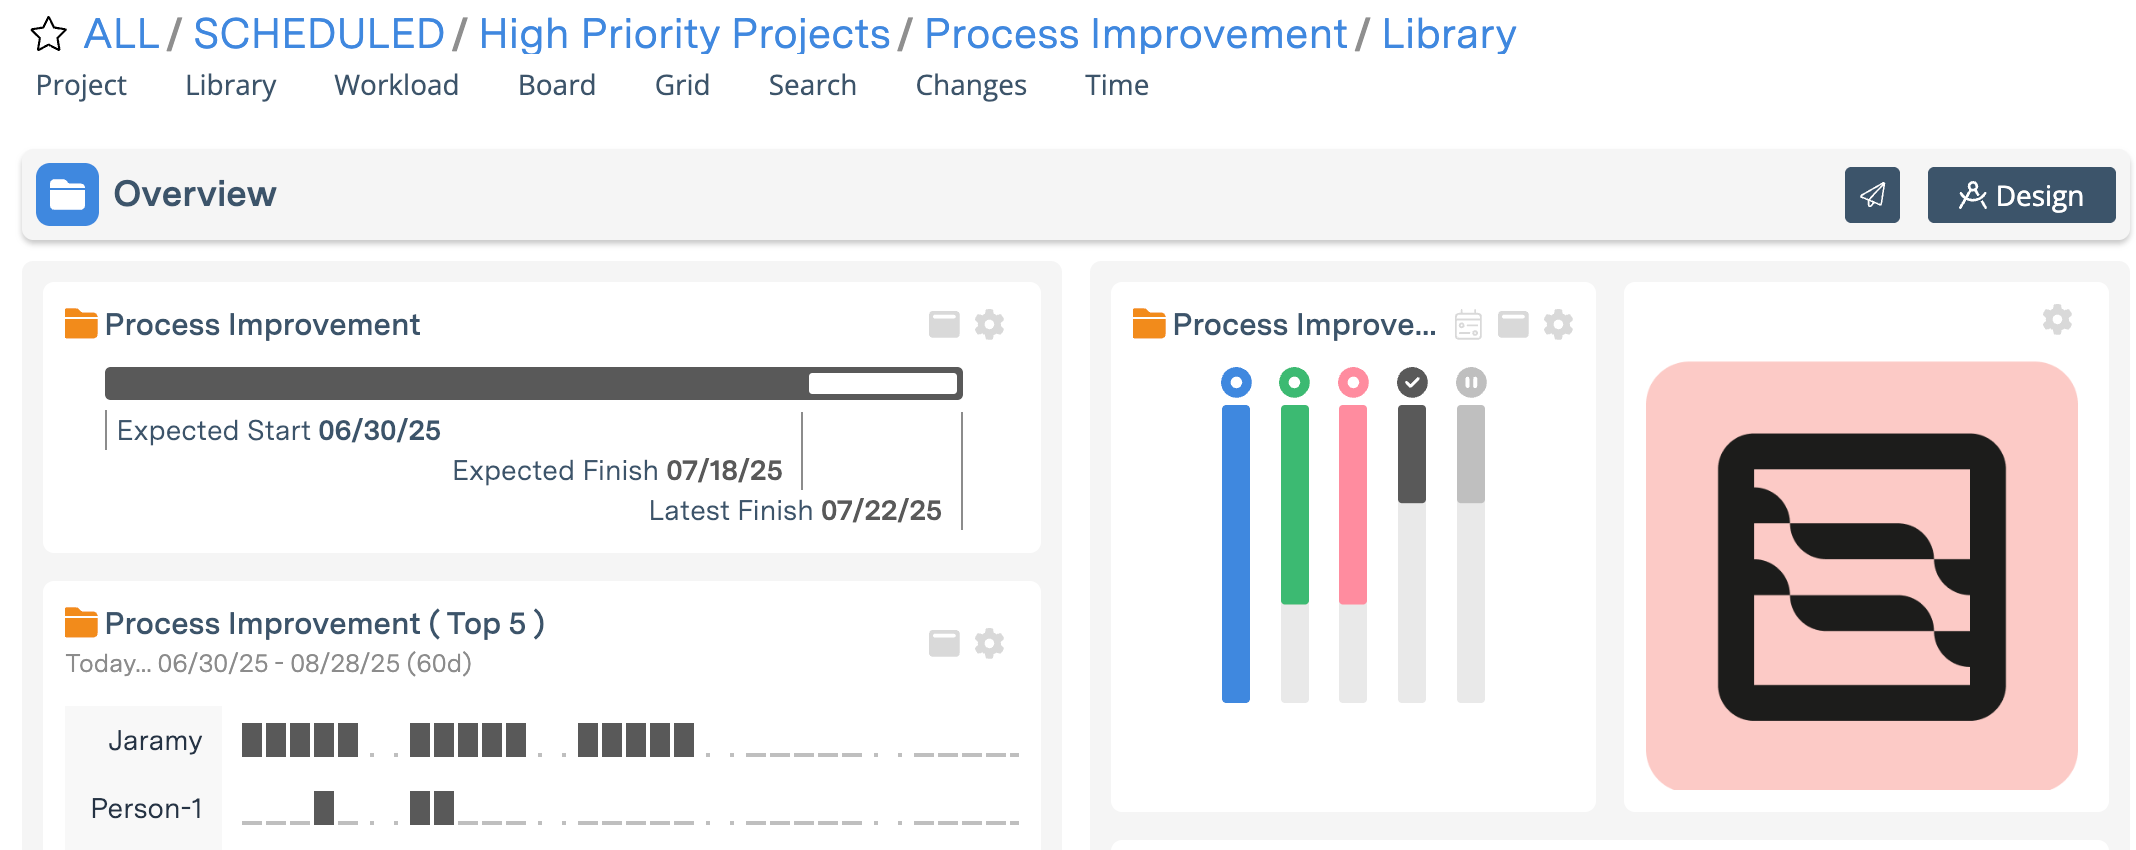
Sample Groups & Widgets on the Project Dashboard
|
A Project Dashboard starts out with eleven Widgets in two Groups. Eight widget types are represented: Schedule Summary, Task Board, Image, Workload, Properties Summary, Metrics Tally, Task List, Changes.
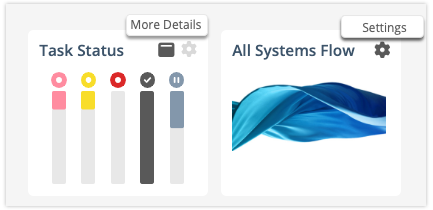
Clicking More Details on the Widget performs a specific action defined in its Settings: it can expand into a View on the Dashboard, open a Plan Item Edit Panel, or navigate to another View in the Workspace.
Project Managers can use Settings to edit widgets without leaving View Mode. For more extensive customization, click Design at the top of the dashboard to enter Design Mode. Here are some things to try:
-
Scope Groups or Widgets to Project Sub-Folders.
-
Apply Filters to Groups and to Widgets that have Data Filter Settings.
-
Change what happens when More Details is clicked on Widgets that have On-Click Settings.
-
Adjust the Layout by dragging Widgets and Groups to new locations on the Dashboard.
-
Add more Widgets and Groups, or Duplicate existing ones and change the scope and filters.
|
4 |
Filtering Groups and Widgets on the Project Dashboard
|
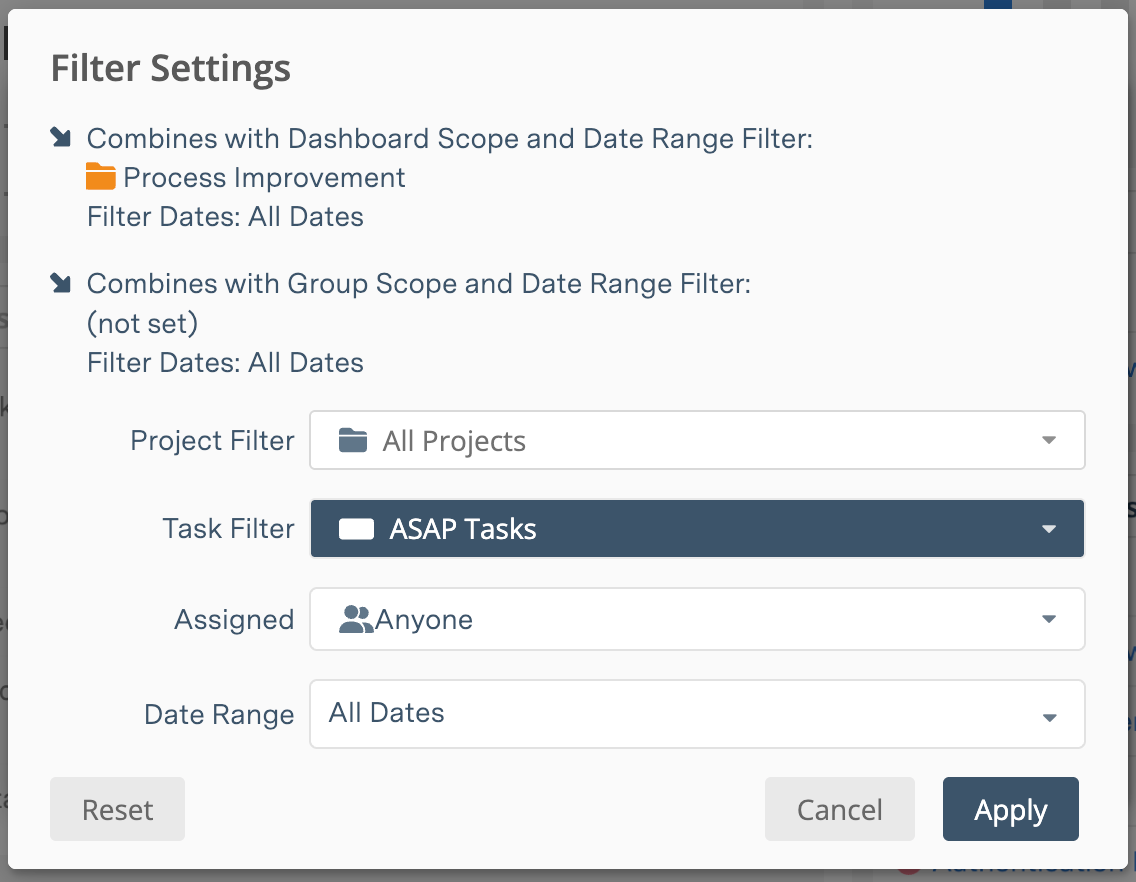
Filtering uses AND logic to identify items that meet all the Scope and Filter criteria. Due to a Project Dashboard’s limited scope, it may be best to keep the Project Dashboard default filters in place and use Scope and Filtering on Groups and Widgets to hone in on project data.
-
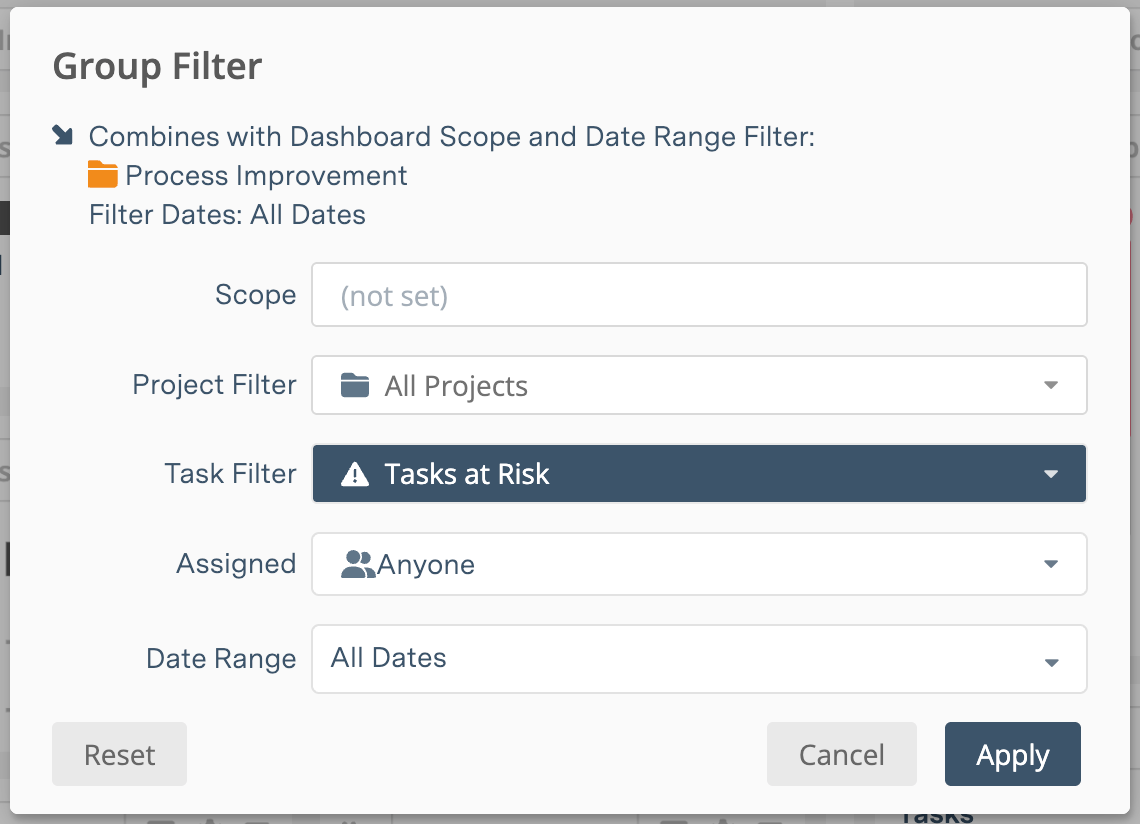
Group Filters are set in Design Mode. Use the filter icon in the Group header to open the filter modal.
-
For widgets, select Settings and then under the Data section, select Filter Settings. This can be done from View Mode or Design Mode.
List Widgets, Metrics Tally, Task Board, and Workload widgets have Data Filter Settings. Learn more in the Widgets & Groups article.
See an example of Group and Widget filtering…
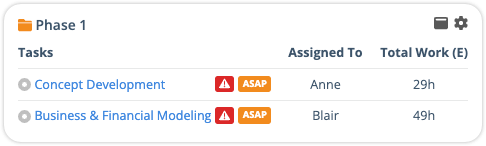
In the example above, a Group is scoped to the Phase 1 Sub-Folder and filtered to Tasks at Risk. A Task List widget in the group is filtered to ASAP Tasks, resulting in a list of Tasks in the Phase 1 Sub-Folder that are at Risk and have priority overrides- ASAP in the Project, ASAP in the Package, ASAP in the Workspace.