Analytics
Calculate time needed to burn down the backlog
Assuming your team can accomplish 10 story points a week, this will tell us how long (in weeks) it will take to burn down work and get to certain items further down the backlog. To adjust how many story points the team can work in a week, simply change the "velocity" value.
WITH velocity = 10:
  CONCAT(SUM#preceding{story_points} / velocity, "w")
For this example to work most effectively, the structure should be sorted based on how you choose which work to complete first. See Sort Generatorsfor more information.
Calculate days past due
This example checks for items that are overdue and returns the number of days the item is overdue.
IF dueDate < NOW():
   DAYS_BETWEEN(dueDate, NOW()) CONCAT " days late"
Compare the original estimate to work logged and the remaining estimate
IF originalEstimate:
    (timeSpent + remainingEstimate) / originalEstimate
ELSE:
    "not estimated"
Calculate the interquartile range of story point estimates
WITH points = ARRAY { storyPoints } :   // Holds all the story points of the children.
  QUARTILE(points, 3) - QUARTILE(points, 1)
Items and Properties
Access an item property
Use the following format: item.property
The following returns the release date for each fix version:
fixVersions.releaseDate
Note: if the fix version field contained multiple values, multiple dates will be returned.
For a list of accessible item types and their properties, see Item Property Reference.
See how many sprints a work item has been added to
sprint.size()
JQL
Query Match
Flag work items that match or do not match a given query.
IF(JQL{<JQL_QUERY>}, "✅ ", "❌")
Replace <JQL_QUERY> with your actual query. For example:
-
IF(JQL{project="CLOUD"}, "✅ ", "❌")> Returns ✅ if the work item is in project “CLOUD”; returns ❌ if it is in another project.
Identify recently created work items
This example identifies work items created within the past 4 weeks.
IF JQL{created > "-4w"}:
  "scope creep"
To look at work items made more or less recently, update the "4w"; to display a different notification, change the "scope creep" text.
Markdown
Change Text Color
This example uses color-coded text to let users know when work item due dates are approaching (or overdue).
IF dueDate < today():
  ":panel[OVERDUE]{color=red}"
ELSE IF DAYS_BETWEEN(today(), dueDate) <= 7:
  ":panel[Due Soon]{color=green}"
ELSE IF DAYS_BETWEEN(today(), dueDate) > 7:
  ":smile:"
ELSE:
  ":panel[Needs Due Date]{color=blue}"
Change Background Color
This example changes the background color of the cell, according to the status category, and returns the summary text for each work item.
WITH format(text, color) = """:panel[${text}]{backgroundColor=${color}}""" :

CASE(status.category,
  "To Do", format(summary, "gray"),
  "In Progress", format(summary, "blue"),
  "Done", format(summary, "green")
)
You can easily customize this by changing the return value, altering the colors, or combining this effect with a larger formula.
Try experimenting with text and background color combinations - this can be a great way to draw attention to key data points.
Customizable Progress Bars - Based on a Custom Progress Field or Function
The following formula creates custom progress bars based on a custom progress field or user function.
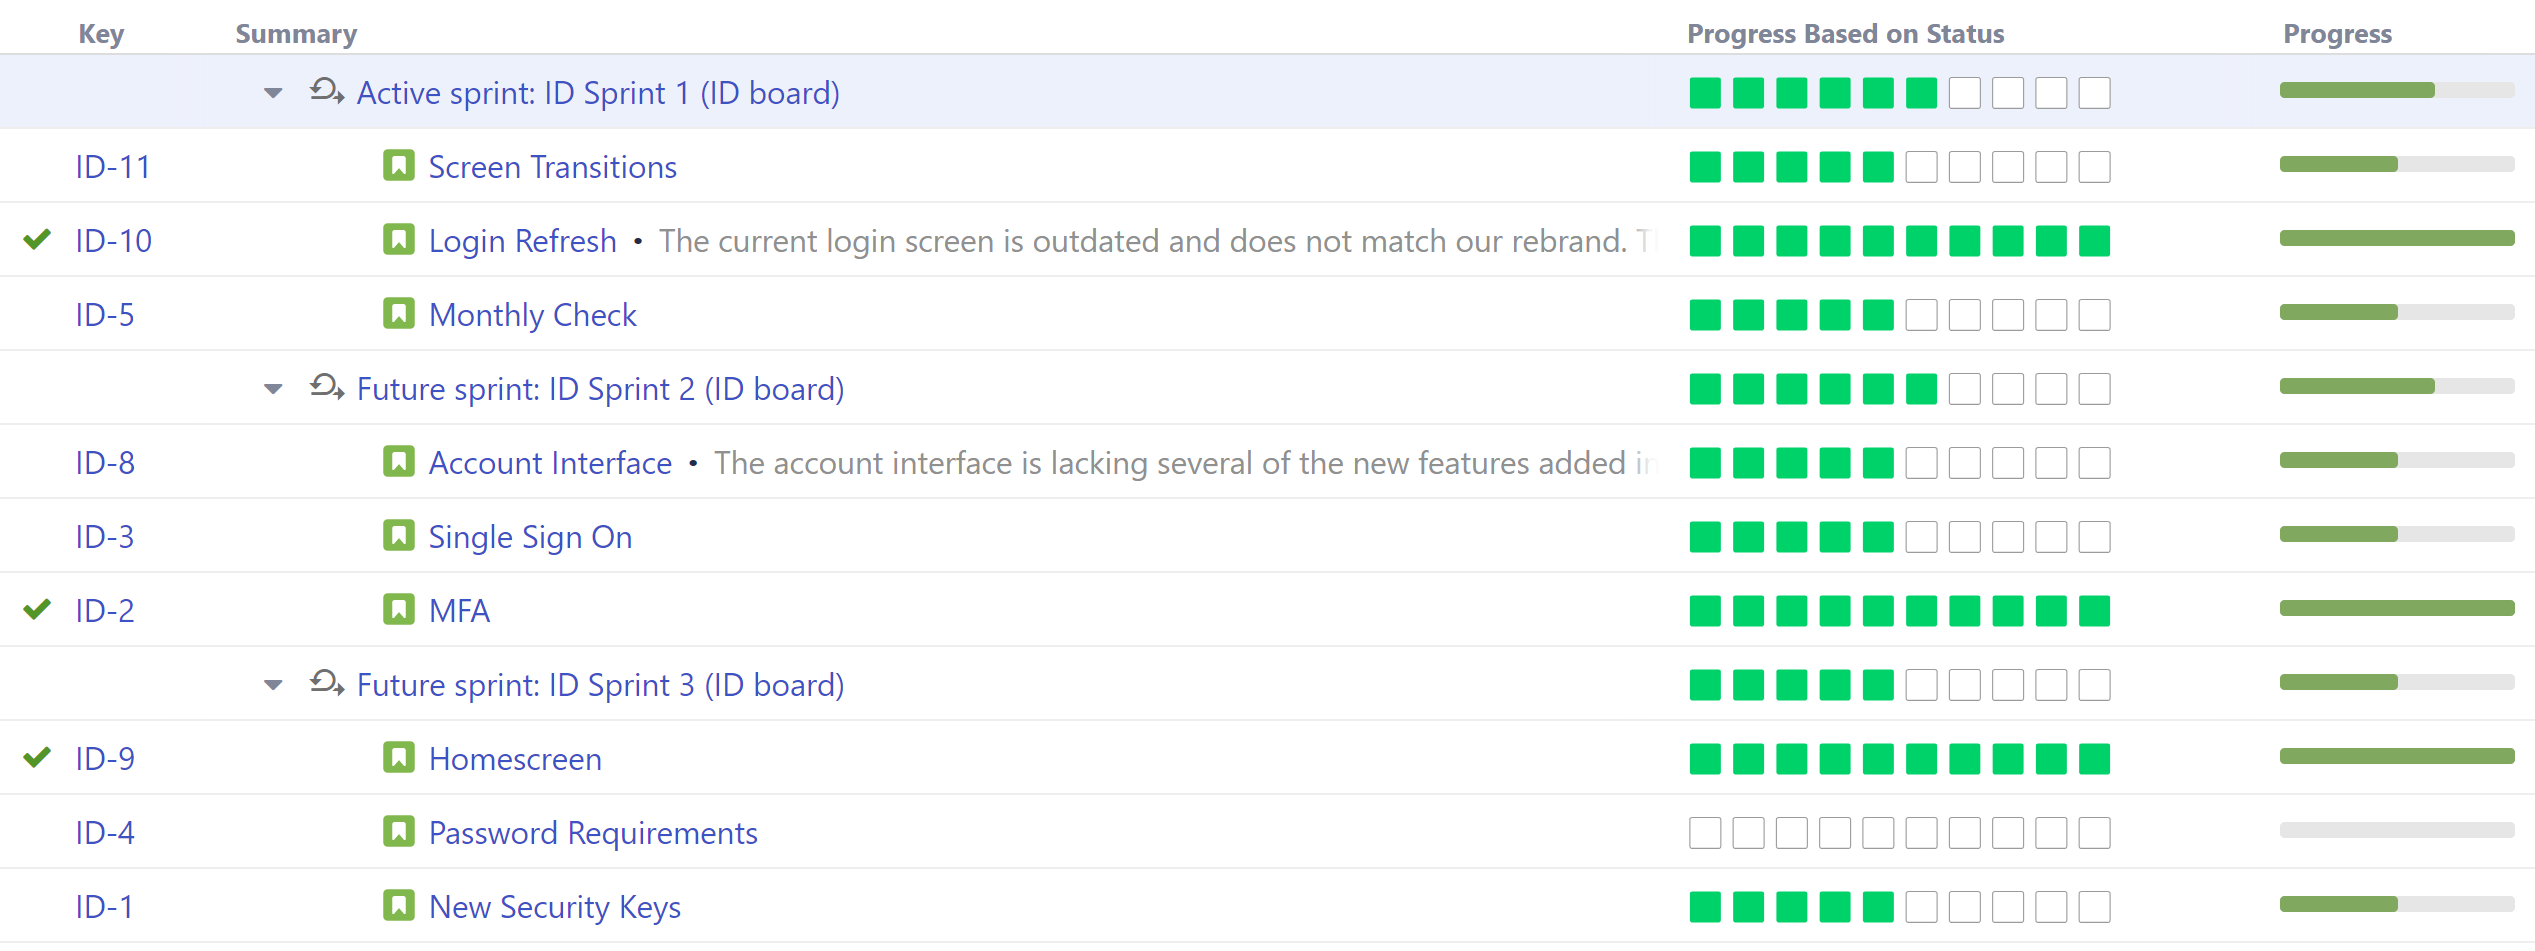
We used the following formula to build the custom progress bar:
WITH simpleProgressBar(progress, maxProgress, stepCount) = (
  WITH _bars(count, emoji) = REPEAT(emoji, count):
  WITH doneBarsCount = FLOOR(progress / maxProgress * stepCount):
    _bars(doneBarsCount, ":green_square:") CONCAT _bars(stepCount - doneBarsCount, ":white_large_square:")
):


simpleProgressBar(customProgress, 1, 10)
Starting with this, you can tailor the progress bar to your team's particular needs.
-
Colors can easily be configured by altering the "color" values - in this case, we used green and white squares.
-
The stepCount value can be adjusted depending on how many squares you want to visualize.
-
The progress calculation (customProgress) can be based on a custom field or custom user function. In the following example, we added a custom user function to mimic the default calculation in our Progress by Status column:
WITH simpleProgressBar(progress, maxProgress, stepCount) = (
  WITH _bars(count, emoji) = REPEAT(emoji, count):
  WITH doneBarsCount = FLOOR(progress / maxProgress * stepCount):
    _bars(doneBarsCount, ":green_square:") CONCAT _bars(stepCount - doneBarsCount, ":white_large_square:")
):


WITH customProgress = AVG {CASE(Status; "Done"; 1; "In Progress"; .5; "To do"; 0)}:
simpleProgressBar(customProgress, 1, 10)
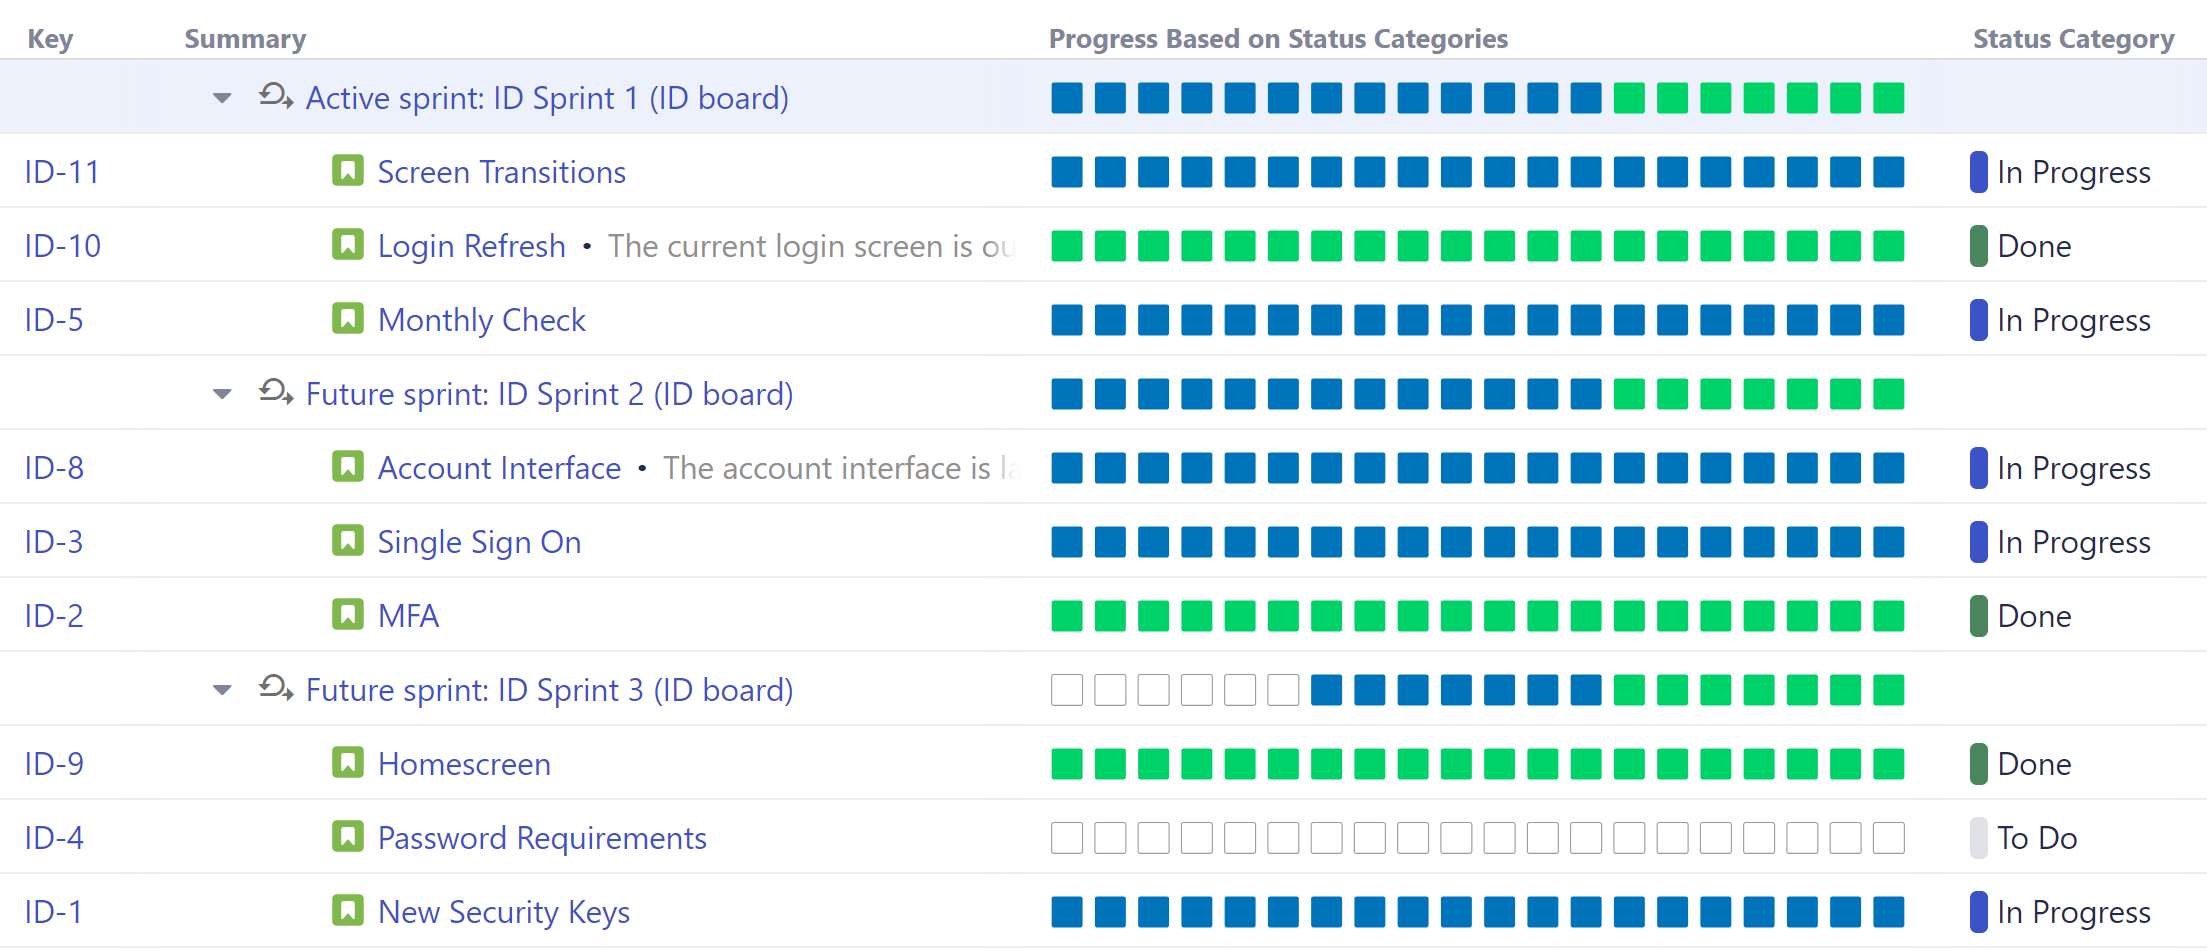
Customizable Progress Bars - Based on Status Categories
The following formula calculates progress based on the Status Categories of the work item and its children.
WITH multiProgressBar(progressArray, maxProgress, emojiArray, stepCount) = (
  WITH _bars(count, emoji) = (IF count > 0: REPEAT(emoji, count) ELSE ""):
  WITH barCountsWithInitial =
    ARRAY(
      ARRAY(ARRAY(ARRAY(0, maxProgress, stepCount))),
      progressArray)
   .FLATTEN() // imitate foldl with initial value
   .REDUCE( (prevArray, p) ->
 	WITH s = prevArray.LAST().get(1):
  	WITH k = prevArray.LAST().get(2):
  	WITH pCount = if (s = 0; 0; FLOOR(p / s * k)):
  	WITH newElement = ARRAY(pCount, s - p, k - pCount):
  	ARRAY(prevArray, ARRAY(newElement)).FLATTEN())
   .MAP(a -> a.get(0)):
  WITH barCounts = barCountsWithInitial.SUBARRAY(1, barCountsWithInitial.SIZE()):
  progressArray.INDEXES()
	.MAP(_bars(barCounts.GET($), emojiArray.GET($)))
	.JOIN("", "", "")
):
WITH all = COUNT#truthy { statusCategory }:
WITH todo = COUNT#truthy { statusCategory = "To Do" }:
WITH inProgress = COUNT#truthy { statusCategory = "In Progress" }:
WITH done = COUNT#truthy { statusCategory = "Done" }:
multiProgressBar(
  ARRAY(todo, inProgress, done), all,
  ARRAY(":white_large_square:", ":blue_square:", ":green_square:"),
  20
)
Users
Show everyone who worked on the task
ARRAY(reporter, assignee, developer, tester)
Note: developer and tester are custom fields - they will be automatically mapped only if those custom fields exist in your Jira instance.
Show everyone who worked on any task in the subtree
VALUES { ARRAY(reporter, assignee, developer, tester) }
Note: developer and tester are custom fields - they will be automatically mapped only if those custom fields exist in your Jira instance.
Versions
Check for a specific fix version
fixVersions.CONTAINS("v1")
If the work item contains that fixVersion, returns 1 (true). Otherwise, returns 0 (false).
Get the latest/earliest fix version
fixVersions.UMAX_BY($.releaseDate) // latest

fixVersions.UMIN_BY($.releaseDate) // earliest
Find the largest time span of an affected version
affectedVersions.MAP(IF $.releaseDate AND $.startDate: $.releaseDate - $.startDate).MAX()
For each Affected Version, subtracts the Start Date from the Release Date, and returns the Affected Version with the largest result.
Want the shortest result? Change MAX to MIN.
Show all versions referenced in the subtree
VALUES { ARRAY(fixVersions, affectedVersions).FLATTEN().UNIQUE() }
Get all fix versions with future release dates
fixVersions.FILTER($.releaseDate AND $.releaseDate > NOW())
Show all released affected versions
affectedVersions.FILTER($.isreleased)
Show all work items released during a set period of time
DATE(“0/Jan/2021”) < fixVersion.releaseDate

   AND fixVersion.releaseDate < DATE (“31/Mar/2021”)
Check that child work items and parent work items have the same Fixversion
with parentVersion = PARENT{FixVersion}:
  if(parentVersion and !parentVersion.contains(fixVersion); "version mismatch")
Display all sprints for child items
Returns any sprints that the work item’s child items are part of.
JOIN#distinct#subtree{sprint}