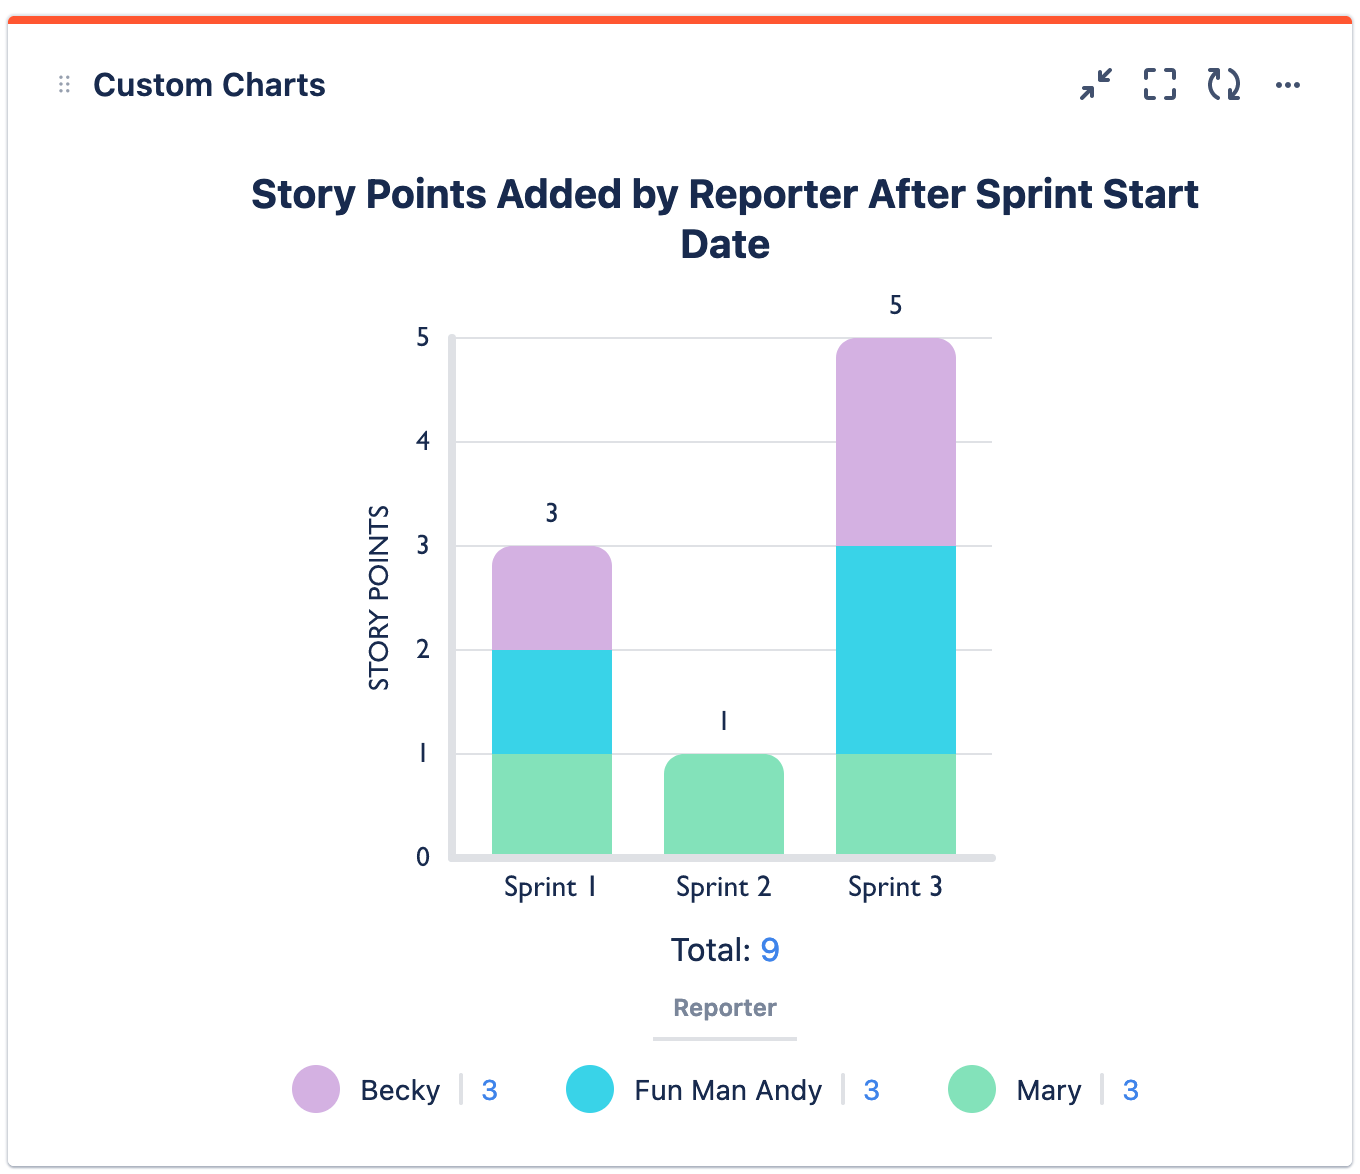
This 2D Stacked Bar Chart shows issues added after each sprint’s start date using a Scriptrunner Enhanced Search filter. With this information, teams can see if scope creep is a pattern across sprints and if there are specific users who contribute to that.
Recreate This Chart In Your Own Instance
Create the Enhanced Search filter for each sprint using the function: addedAfterSprintStart()
Set up Custom Charts
-
Set the Source to Advanced (JQL) and use the JQL statement: Sprint is not empty
-
Set the Chart type to 2D Stacked Bar Chart
-
Set the Chart by dropdown to Saved Filters
-
Set the Group by dropdown to Reporter
-
In the Chart by tab on the right, add in the Enhanced Search filters you made for each sprint
-
Optional: Give your chart a title and combine or rename any segments
-
Click Save or Insert