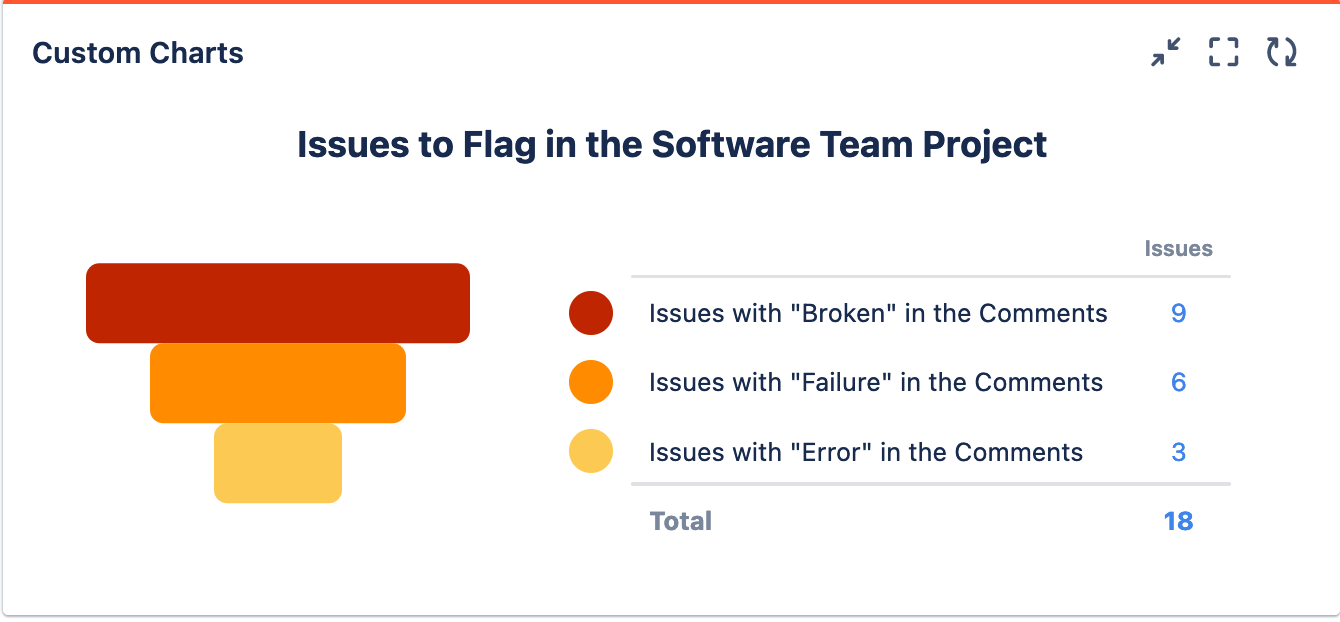
This funnel chart shows issues that have specific key terms “broken”, “failure”, or “error” in the Comment field using a Scriptrunner Enhanced Search filter. Using this report, the team can pinpoint which issues to keep a close eye on.
Recreate This Chart In Your Own Instance
Create 3 Enhanced Search filters, one for issues with the word “broken” in the comments; one for issues with the word “failure” in the comments; and one for the word “error” in the comments. Use the functions below:
-
Filter 1: issueFunction in issueFieldMatch("", "comment", "Broken")
-
Filter 2: issueFunction in issueFieldMatch("", "comment", "Failure")
-
Filter 3: issueFunction in issueFieldMatch("", "comment", "Error")
Set up Custom Charts
-
Set the Source to Projects and choose your desired project(s)
-
Set the Chart type to Funnel Chart
-
Set the Chart by dropdown to Saved Filters
-
In the Chart by tab on the right, add in the 3 Enhanced Search filters you made
-
Optional: Give your chart a title and and rename any segments
-
Click Save or Insert