The Group By tab is available on all 2D charts. These options let you decide how to organize and customize the group segments of your chart.
|
Option |
Description |
|---|---|
|
Show zero counts > On chart |
Displays segments with no data on the chart. |
|
Show zero counts > Highlight rows in editor |
Marks empty segments with an outline to make them easier to identify. |
|
Colors (table charts only) |
Toggles the use of colored icons for each row of data. |
|
Ordering |
Sets the ordering method for each segment in the chart. |
|
Minimum and maximum (one-dimensional charts only) |
Sets the upper and lower limits to display. 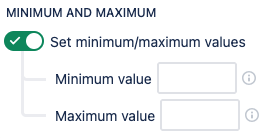
|
Dates options
The following options are only available after setting your Chart by source to Dates.
|
Option |
Description |
|---|---|
|
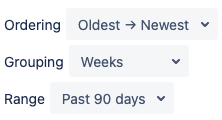
Ordering |
Sets the sorting order from Oldest → Newest or Newest → Oldest. |
|
Grouping |
Determines how the range of dates is grouped. |
|
Range |
Sets the range of dates to display. The amount of total dates will change based on their grouping. |