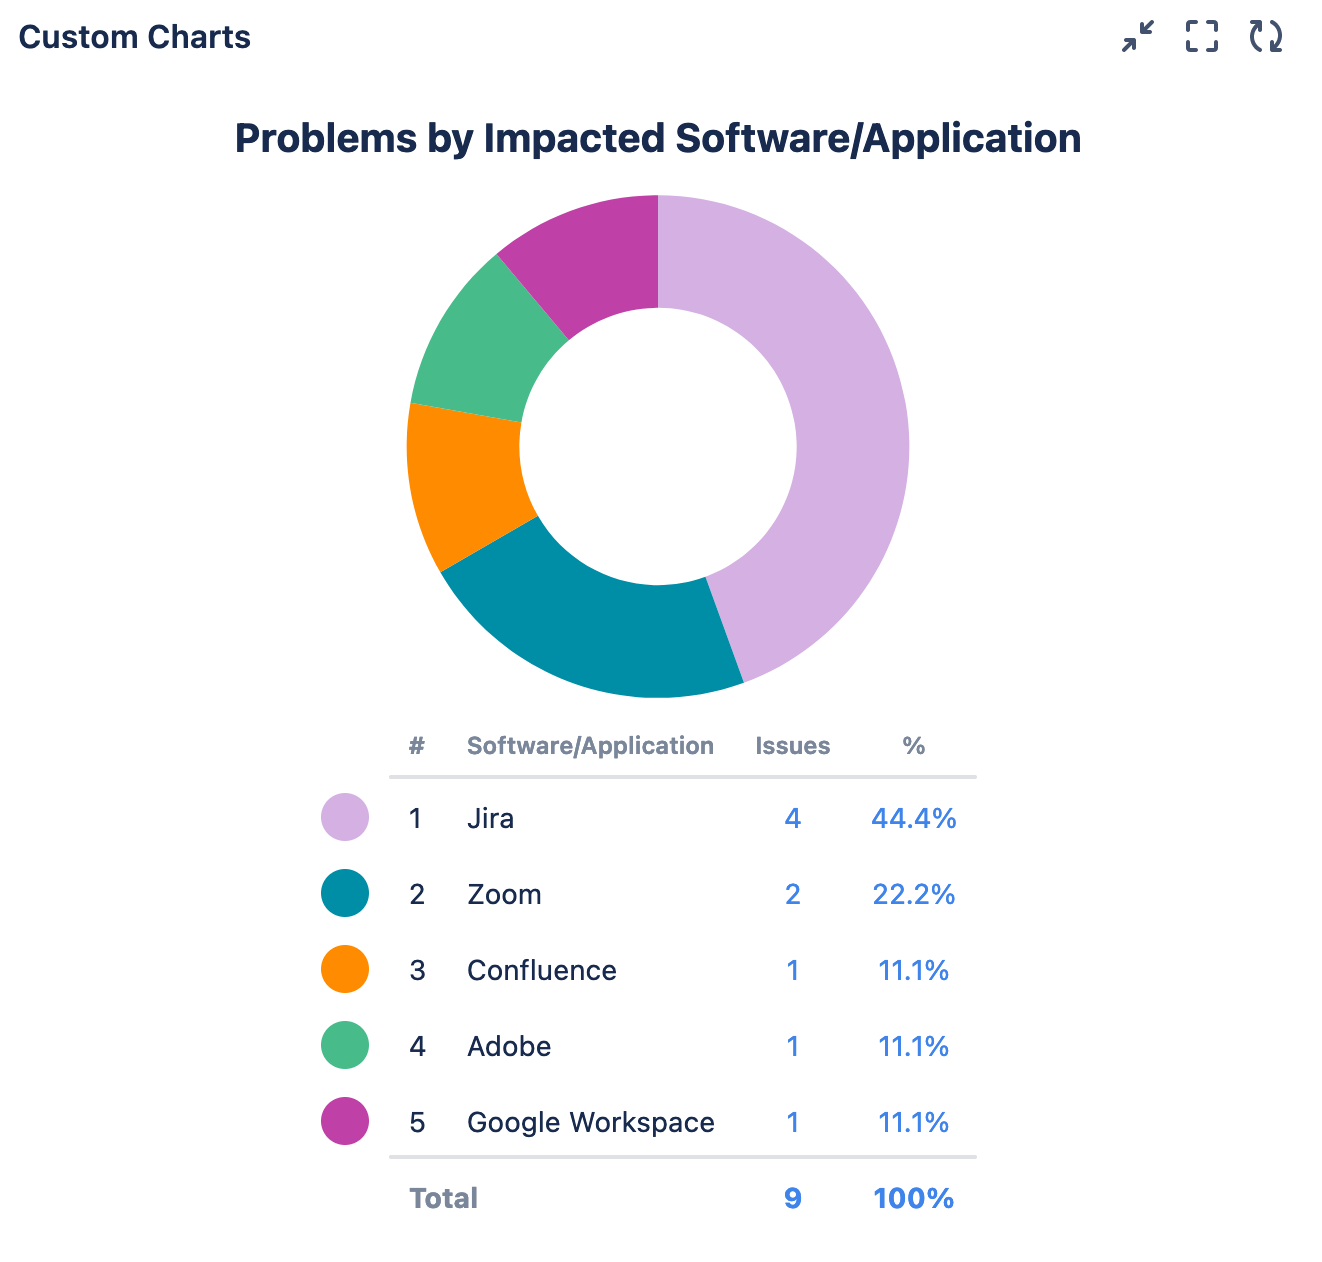
This pie chart shows Software/Application objects from Assets that relate to Requests submitted by customers. We are pulling in the custom Asset Object field we made for our Software/Application assets (“Software/Application”).
Recreate This Chart In Your Own Instance
-
Add the Custom Charts gadget or macro to your Dashboard or page
-
Set the Source to Projects and select your JSM project
-
Set the Chart type to Pie Chart
-
Set the Chart by dropdown to Software/Application (or whatever the name of your Asset object custom field is for your Software/Application Asset)
-
Optional: Give your chart a title and combine or rename any segments
-
Click Save or Insert