Add this chart to your instance
-
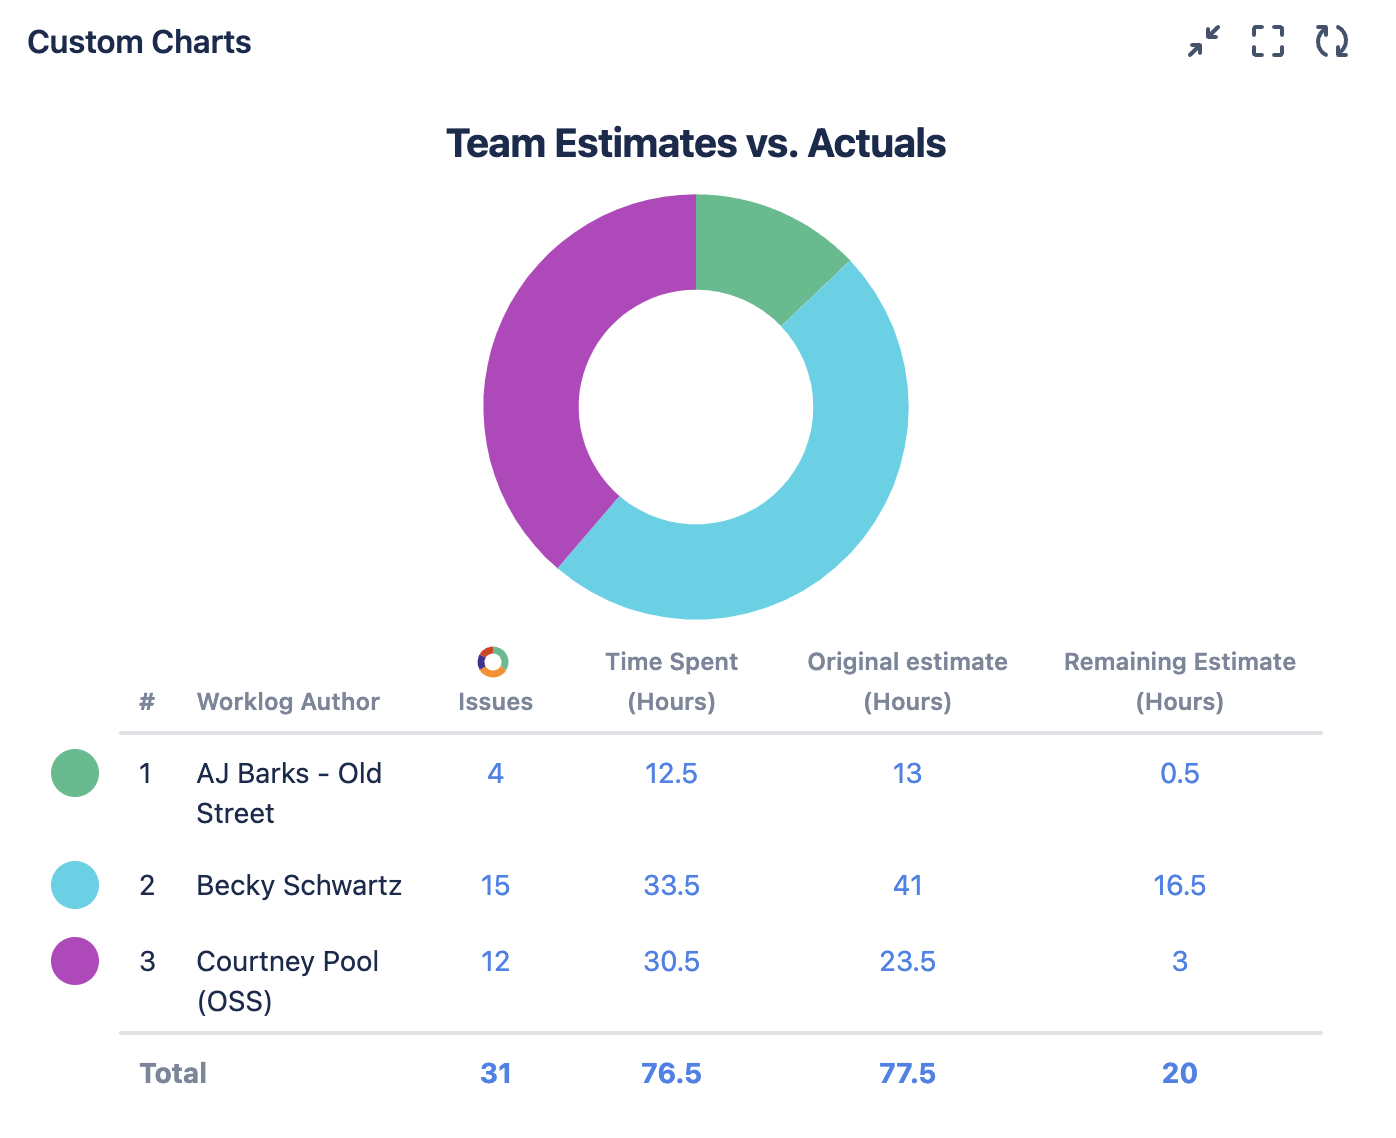
Once you’ve set the Source to pull in the desired Jira data, set the Chart by dropdown to be Worklog Author
-
Navigate to the Calculate dropdown. Switch the first dropdown from Count to Sum, then select Time Spent for the second dropdown
-
Click the Legend tab on the right side of the chart or macro and click Add Column at the bottom of the section
-
In the 2 Calculate dropdowns that appear, choose Sum for the first dropdown and Remaining Estimate for the second dropdown
-
Optional: Give your chart a title and navigate to the Display Options tab to change the Time Unit (the default is hours)
-
Click Save or Insert