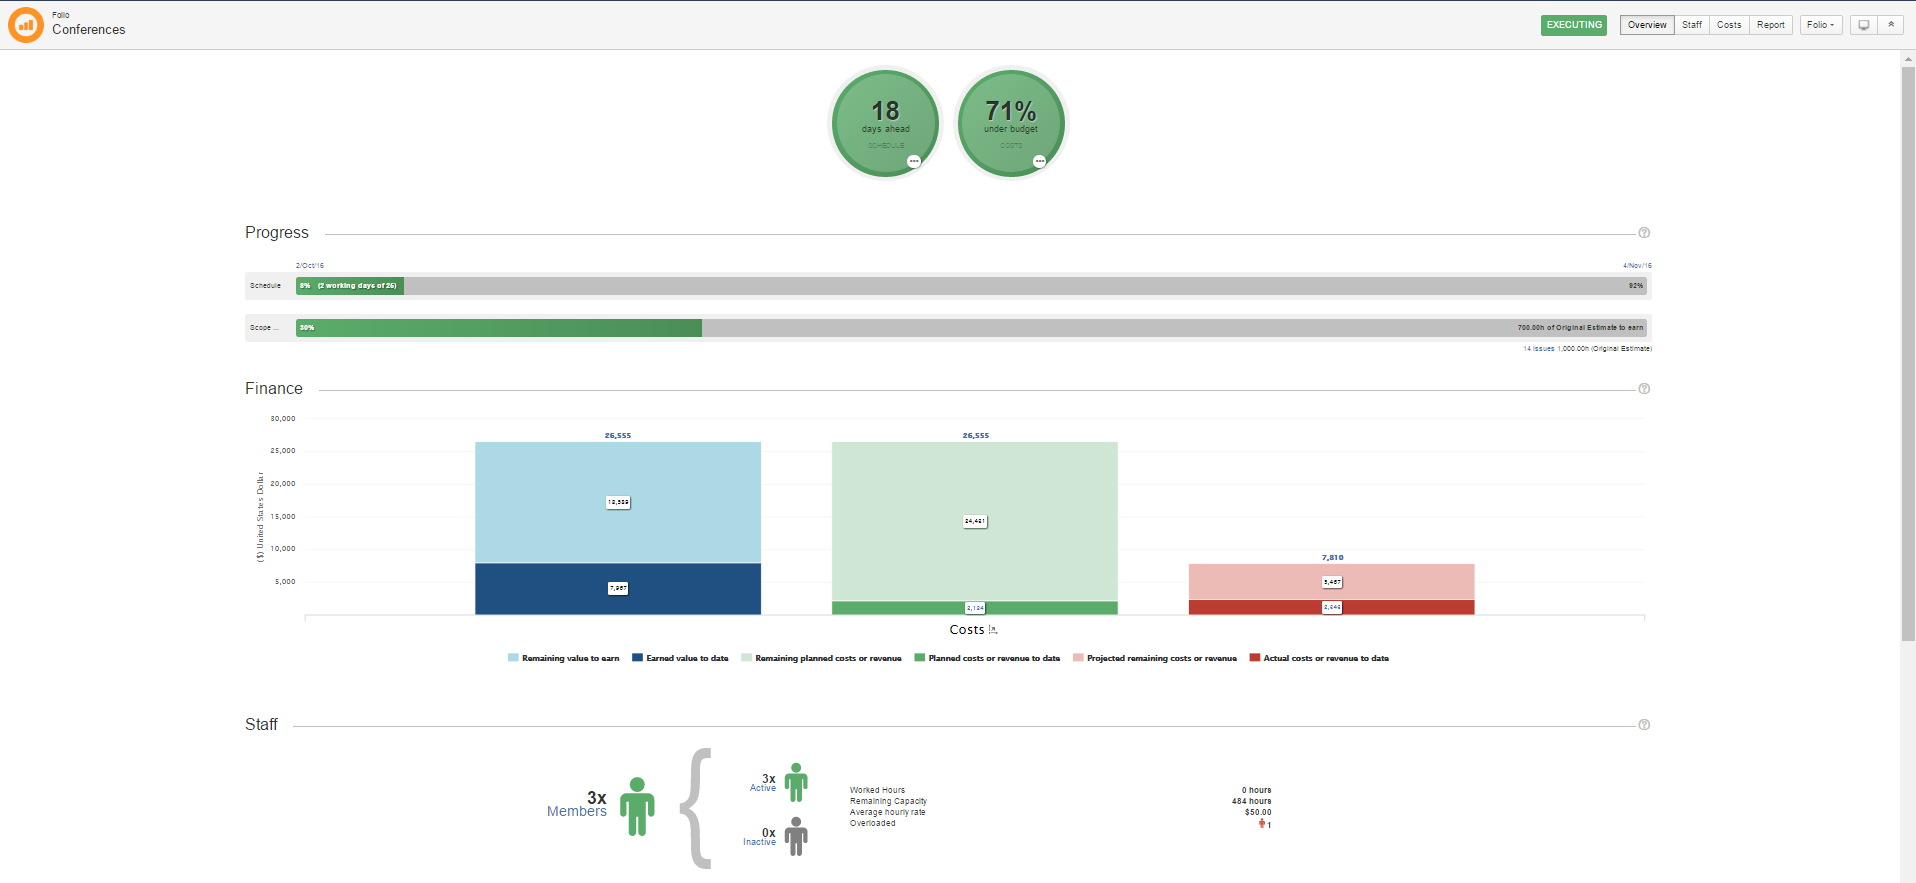
The Folio Overview page allows you to see the current performance and progress of a folio, including any sub-folios that appear under it.
The Dashboard is subdivided into seven sections: Traffic Light Indicators, Progress, Folio Overview | FolioOverview Finance, Folio Overview | FolioOverview Staff, Additional Information and Folio Overview | FolioOverview Notes.
All sections are collapsed on the Dashboard, except for Traffic Light Indicators and Progress.
-
Click the arrowhead by each title to expand the required sections. Click again to collapse.
-
Set your default preference (expanded or collapsed) for each section. Click the pin on the right-hand side of the title, to set as default.
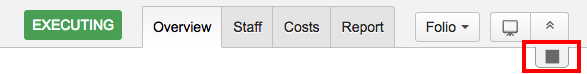
To refresh the data in the Dashboard, click the Refresh Current Portfolio button. The data is refreshed from cache asynchronously and when completed displays a timestamp in the tooltip.
The Header of the page provides you with the name of the selected folio and its status (Pending, Executing, Expired, Closed) and lets you access detailed information on its associated staff, costs and available reports.

Depending on your user rights, you can close a folio, regardless of its status, by clicking the Status button
Traffic Light Indicators
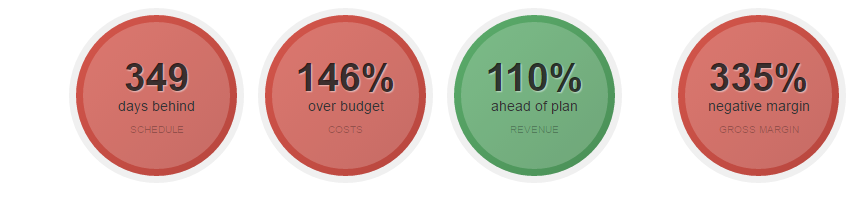
The following table describes the traffic light indicators available under the Folio Overview page:
|
Traffic Light |
Information |
|---|---|
|
Schedule |
The difference between the planned and projected dates. If there are several folios available in this folio, the number displayed indicates the worst schedule performance of the group. |
|
Costs |
The percentage of variation between the budget and the actual cost to date. The percentage displayed is the sum of the actual costs to date of all folios in this folio compared to their total planned costs and multiplied by their completion ratio. |
|
Revenue |
The percentage of variation between planned and actual revenue to date. The percentage displayed is the sum of the actual revenue to date of all the folios in this folio compared to their total planned revenue multiplied by their completion ratio. |
|
Profits/Gross Margin |
The gross profit margin to date. The percentage displayed indicates the total profit to date divided by the total revenue to date. |
The system uses the following color schemes to indicate statuses:
-
Green: On track. All aspects of folio viability are within tolerance.
-
Amber: Some issues are having a negative effect on the folio. Viability is at risk
-
Red: Problematic. Serious, high-risk concerns are threatening the overall performance of the folio.
-
Grey: No data available for the time being
If all the folios within the folio use the Earned Value Management (EVM) functionality, you hover your cursor over the ellipsis of the traffic light to obtain more at a glance information, namely the related EVM indices.
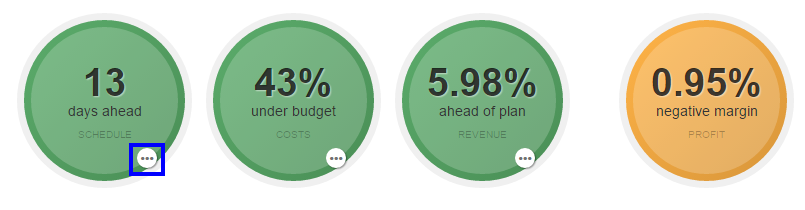
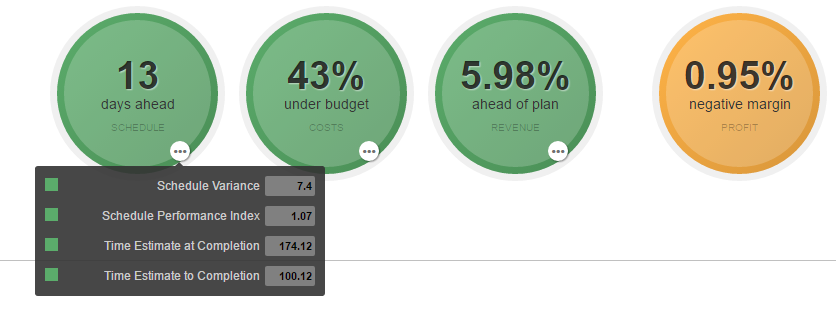
You can also click the traffic light to drill down and obtain more detailed information on this particular area of the folio.
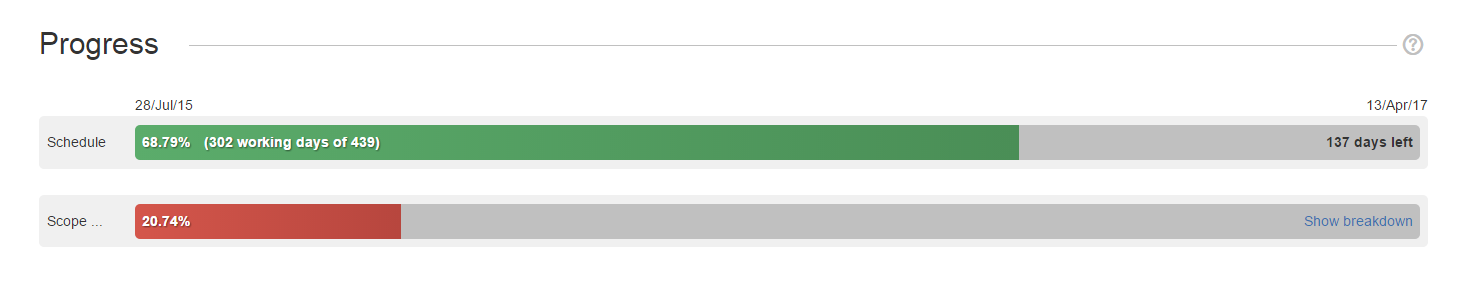
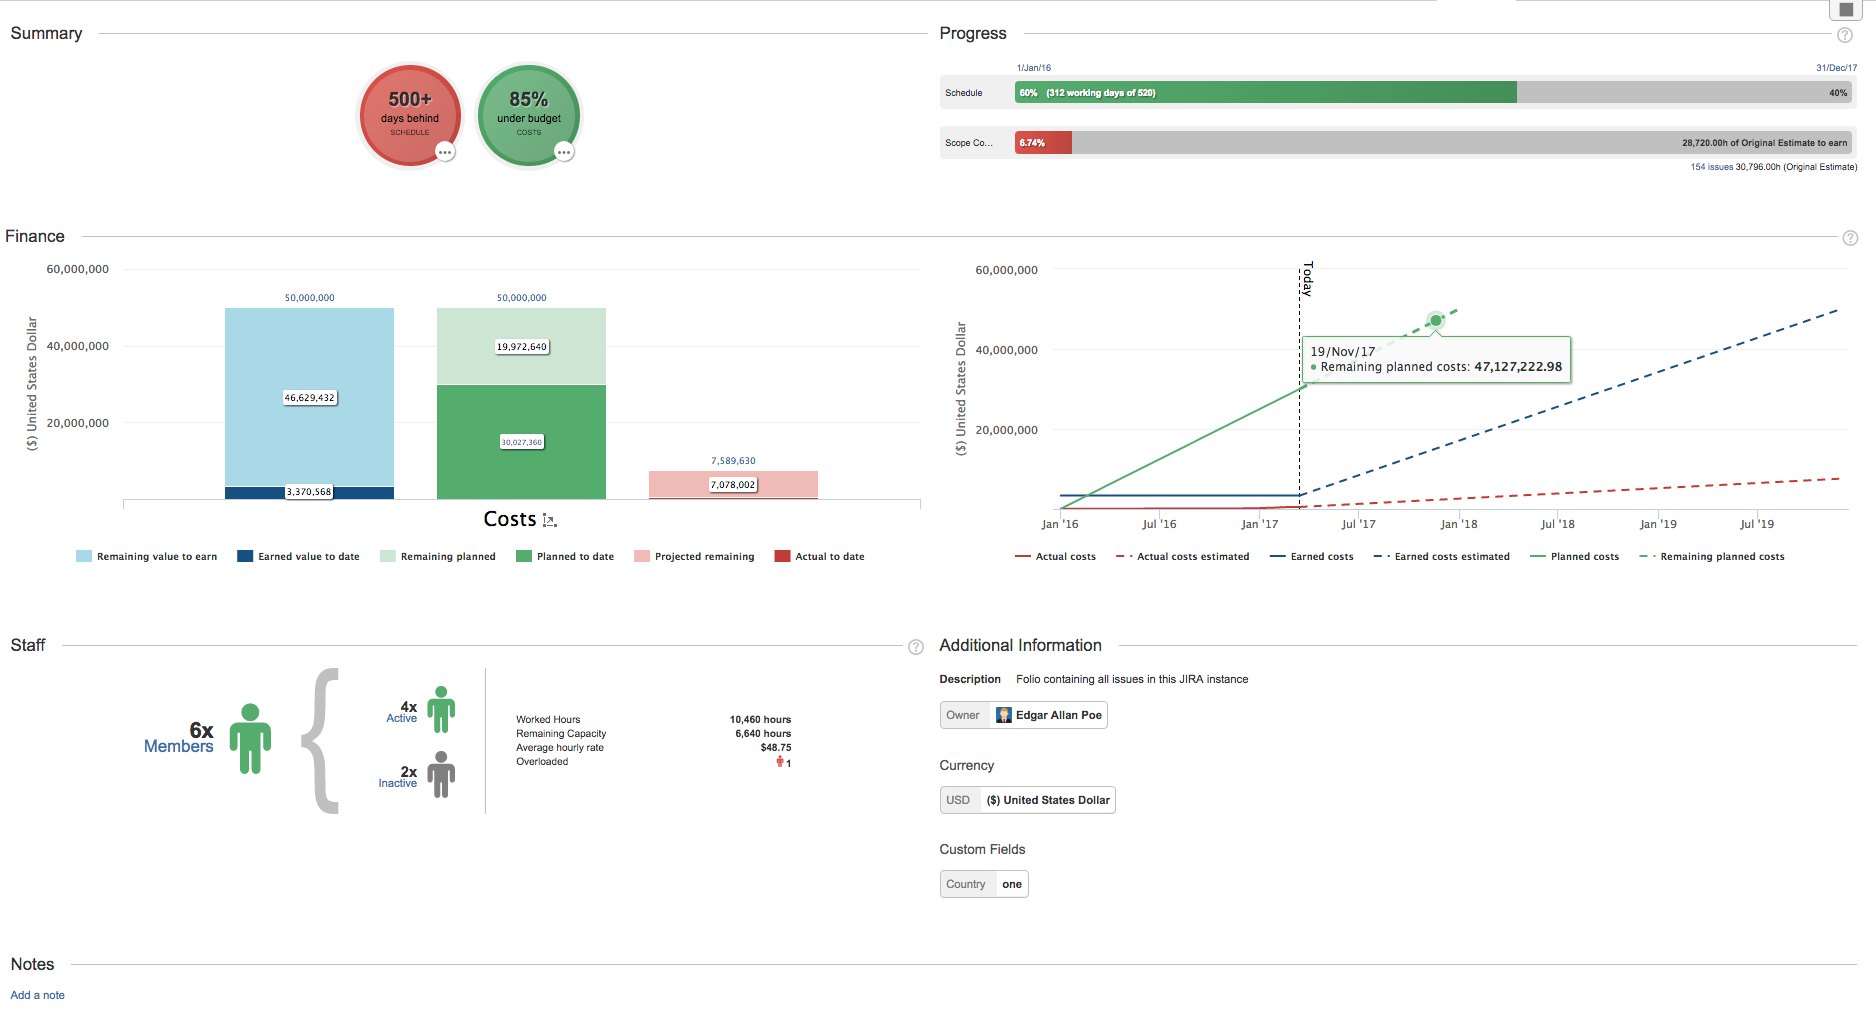
Progress
This section compares the schedule and the scope completion progress.
-
The Schedule progress bar displays the number of completed working days elapsed since the start date.
-
The Scope progress bar displays the completion ratio. The completed ratio indicates how much value was earned to date versus the project's total planned value. It is computed by dividing the earned Original Estimate to date by the total sum of the Original Estimate to earn. You can click the Scope bar to view information on the Resolved and Closed issue types related to the project (Stories, Epics, Tasks, etc.)
You can click the Issues link of the Scope progress bar to obtain more information on all the issues associated to the folio.

Note: The Scope progress becomes red if lower or equal than the Schedule progress.
Finance
This section is collapsed by default. Click the arrow next to the title to expand it.
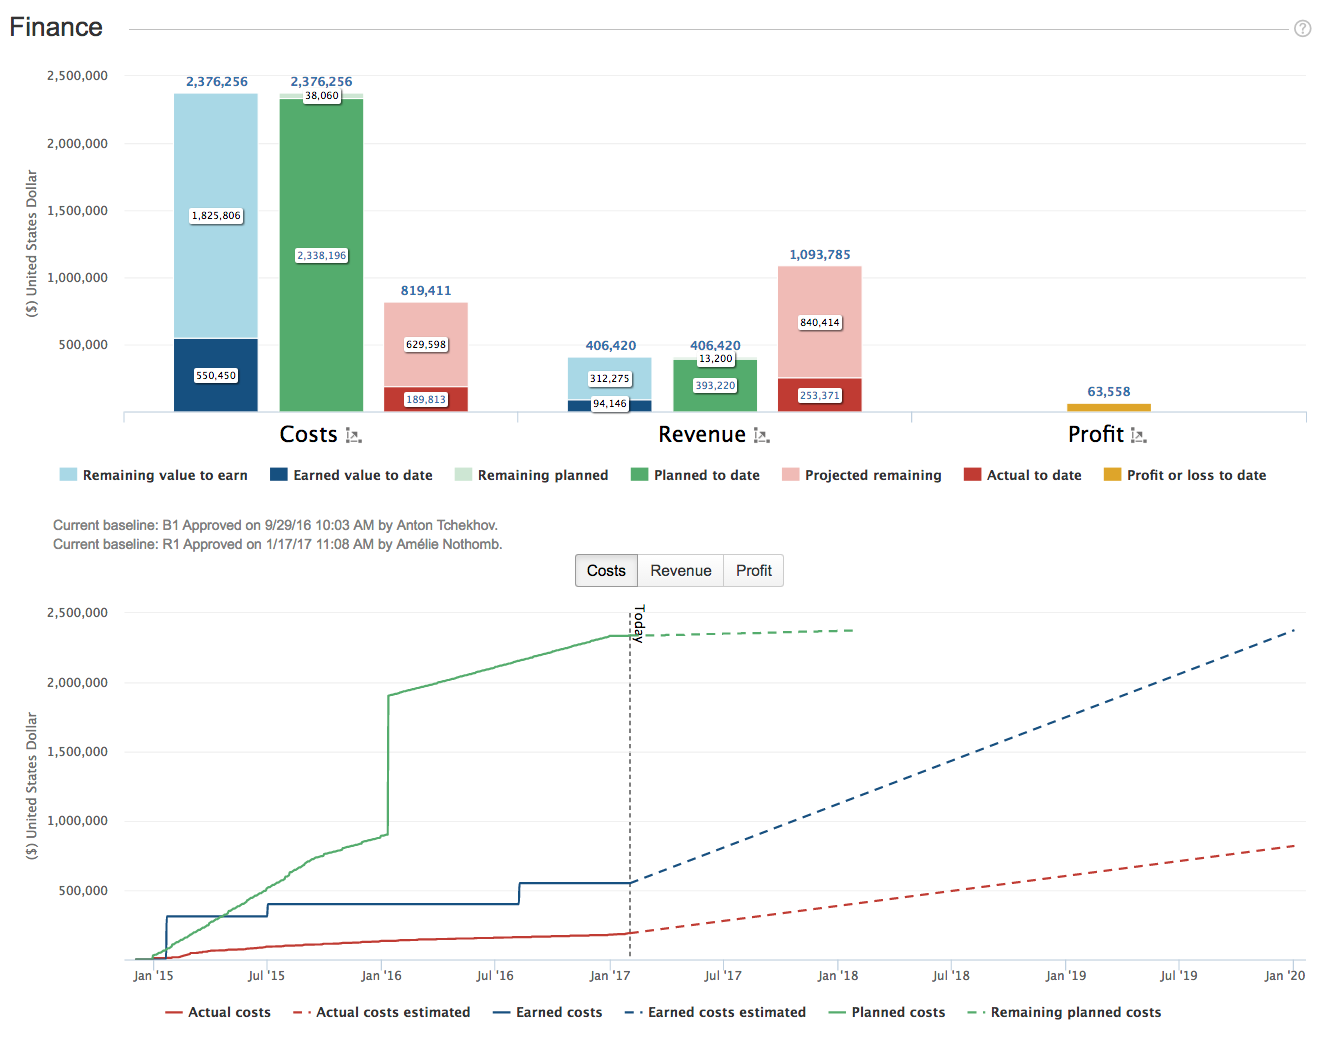
The Finance section displays two charts which provides the current financial picture of the folio. The first chart bars allow you to compare various values to date (bright bar portions) along with projected values at completion (pale bar portions), such as estimated costs or revenue at completion.
The second chart shows you the evolution over time of various amounts, showing trends and projections. That chart can be toggled in three modes: Costs, Revenues or Profits, each one showing the relevant curves.
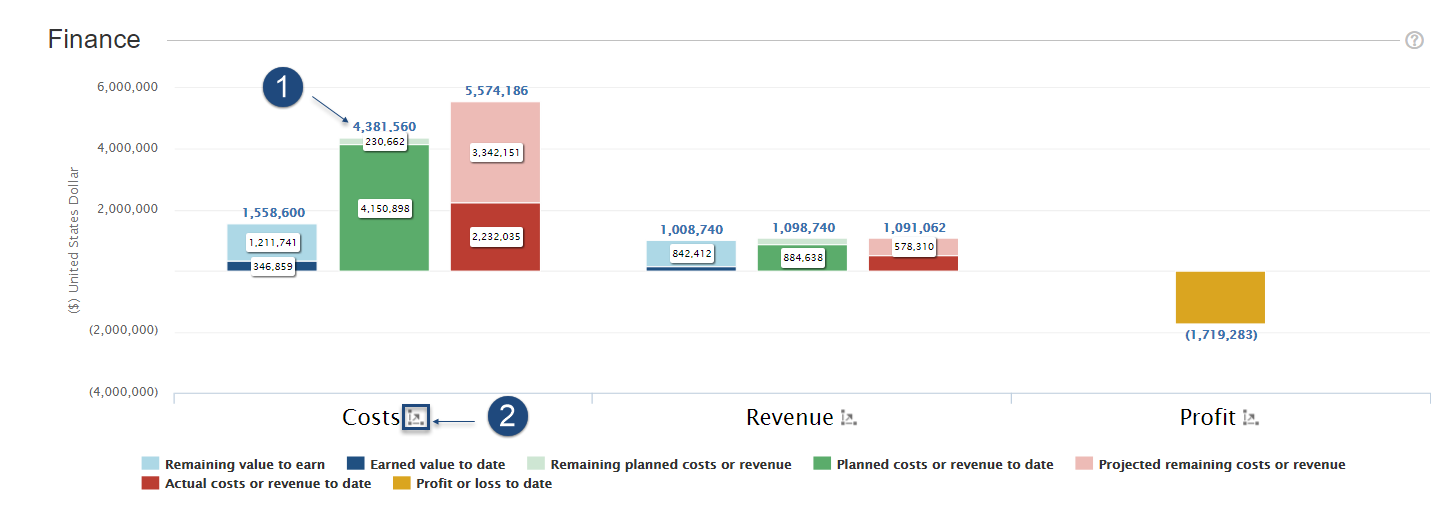
Finances to Date: Bar Chart
The following table describes the metrics displayed in the Finances to date chart: each bar is colour coded to represent a specific metric.
|
Metric |
Definition |
|---|---|
|
Remaining value to earn |
The sum of the remaining value to earn for all EVM folios in this portfolio. |
|
Earned value to date |
Earned value to date is equal to the total earned value of all EVM folios in this portfolio. |
|
Remaining planned costs or revenue |
The total remaining planned costs or revenues to date for all the folios in this portfolio. |
|
Planned costs or revenue to date |
Indicates the sum of the planned revenue of all then folios in this portfolio that should have been realized to date or the total planned costs to date for all folios in this portfolio. |
|
Projected remaining cost or revenue |
The sum of the forecast based on prior sales numbers and anticipated increases in expense. |
|
Actual costs or revenue to date |
Indicates the sum of the actual costs to date of all the folios in this portfolio. |
|
Profit or loss to date |
Indicates the profit or loss to date for all the folios in this portfolio. |
Click the values above the bars and numbers to go to the corresponding screen (Cost/Revenue summary or forecast)
Click the icons next to the X-axis labels to go to the corresponding forecast chart which shows the detail over time for the whole time frame.
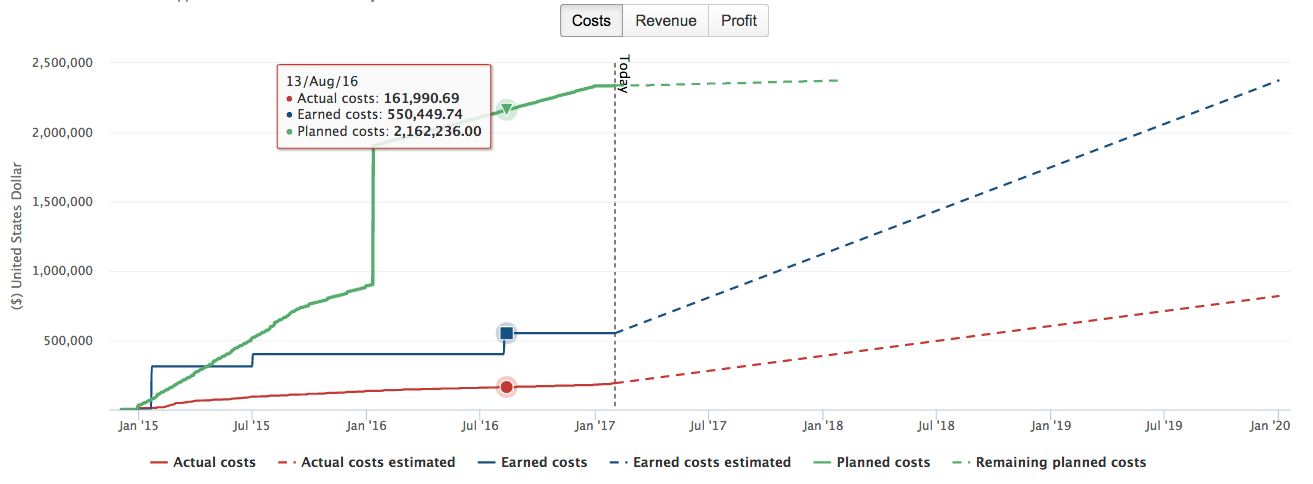
Finances trend: Line Chart
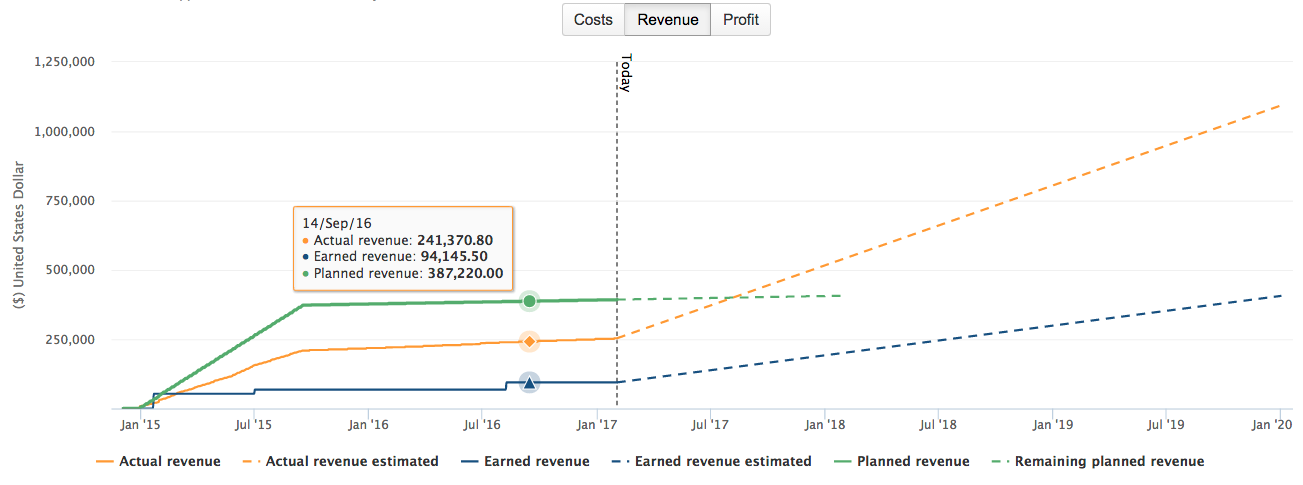
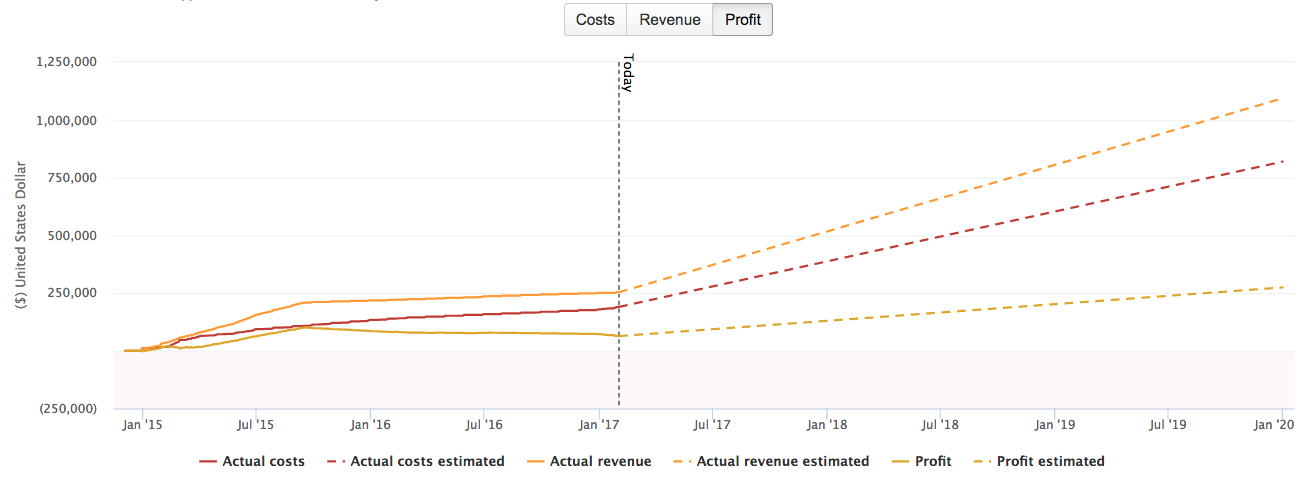
The line chart of the Finances section shows the trend over times of costs, revenues and profits, both planned and actual. A dashed vertical line indicates today's date. Past values appear as solid lines while projected values appear as dashed lines. Hovering one of the lines of the chart brings up a tooltip with precise values for that specific dates. For more in-depth trend and forecast information, visit the Forecasts pages (Costs > Forecast and Revenue > Forecast) of the folio. The legend items are clickable and allow you to show/hide certain line portions in the chart.
The Costs mode of the chart compares planned costs, actual costs and costs earned value (blue).
The Revenue mode of the chart compares planned revenues (green), actual revenues (yellow) and revenues earned value (blue).
The Profit mode of the chart compares actual costs (red), actual revenues (orange) and profit (yellow).
Staff
This section is collapsed by default. Click the arrow next to the title to expand it.
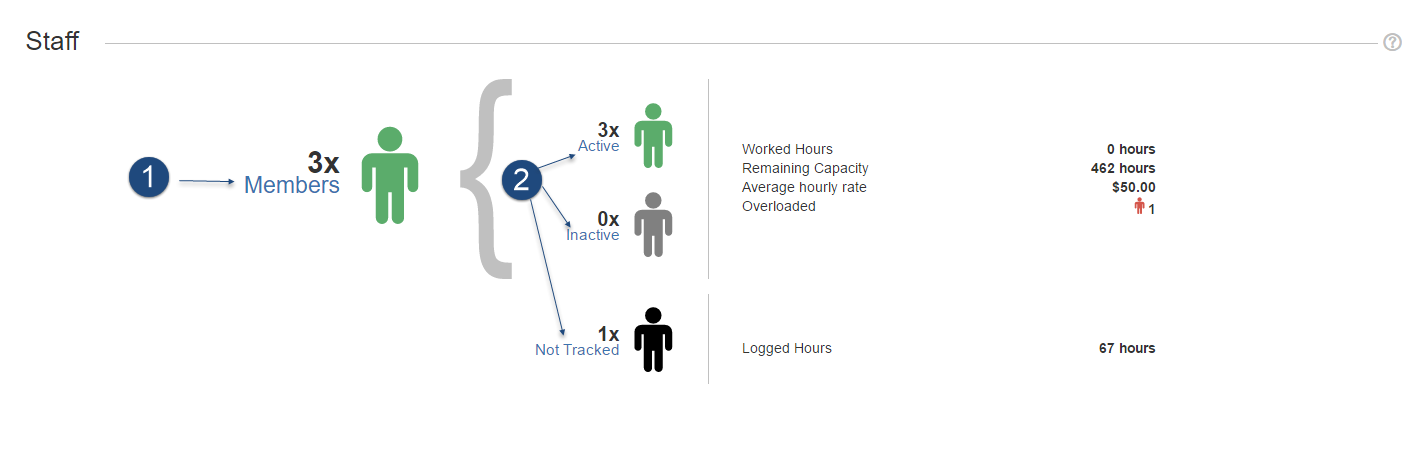
The Staff section gives you an overview of the current states of this portfolio's staff. The staff activity status and remaining capacity is based on each member's specified availability.
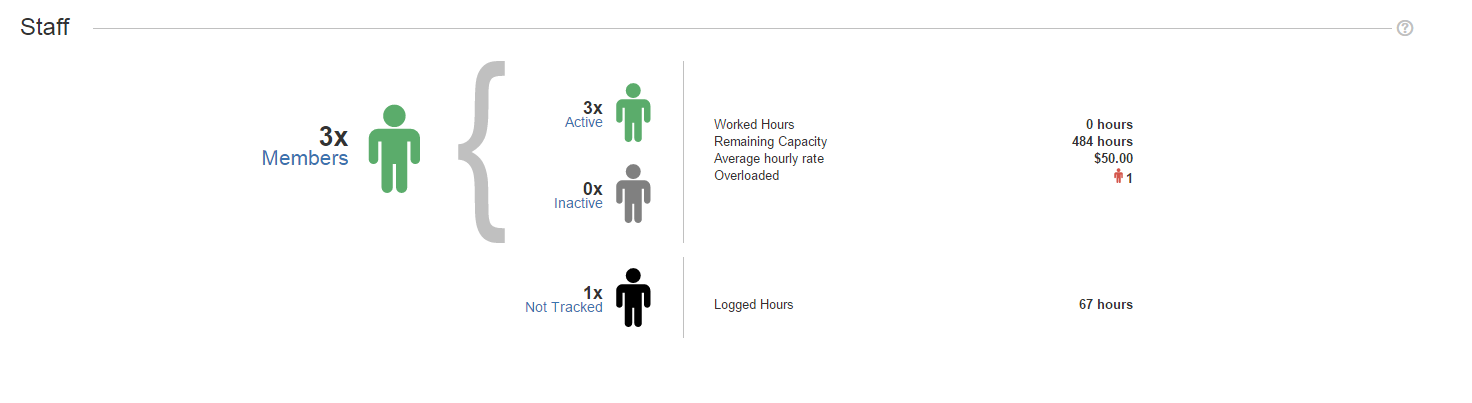
The section on the right side of the screen provides the following information on the members assigned to this portfolio:
|
Field |
Description |
|---|---|
|
Worked hours: |
Indicates the total sum of worked hours to date for the allocated members. |
|
Remaining Capacity: |
Indicates the total remaining capacity of all staff members until the planned end date, based on their specified availability. |
|
Average hourly rate: |
Current average cost rate weighted by the current availability percentage of all active staff members. |
|
Over allocated: |
The number of over allocated members, meaning: the number of members whose total specified availability for all folios in this portfolio is greater than 100%. |
|
Logged Hours |
The number of hours entered on this project by the staff. |
1. Click the Members link to display the the Folio Staff Summary capacity chart.
2. Click the Active, Inactive or Not Tracked link to display information on the Folio Staff Members.
 Additional Information
This section is collapsed by default. Click the arrow next to the title to expand it.
The Information section provides you with additional information on the folio (for example: the currency used, the Project Manager, etc.) and lets you enter a description by clicking inside the Description field.
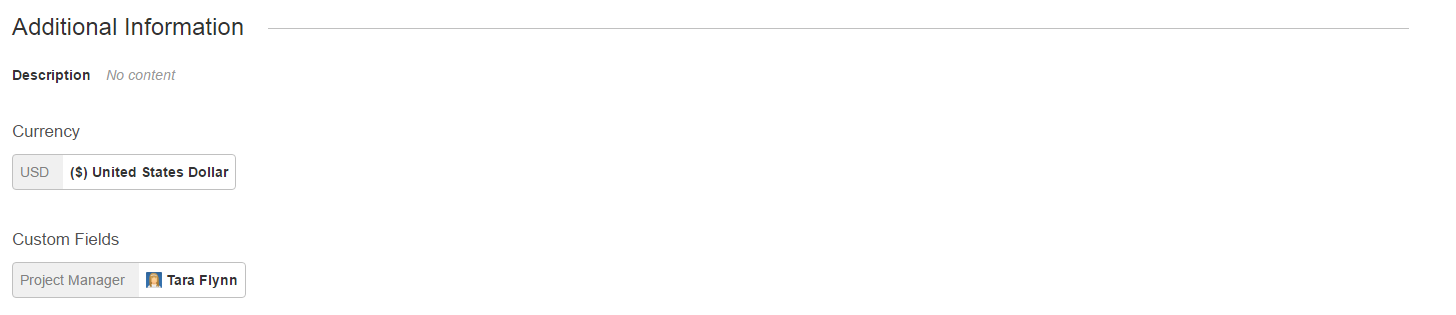
Note: Whether or not you can modify the information in this section depends on your user rights.
Notes
This section is collapsed by default. Click the arrow next to the title to expand it.
The Notes section lets you add additional notes.

To do so:
1. Click the Add a note link.
2. Enter the note.
3. Select the Level (Information, warning, success, important).
4. Click the Add Note button.
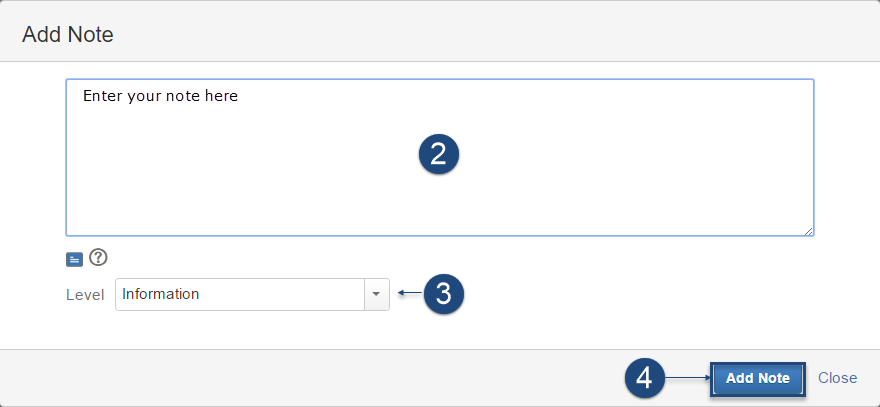
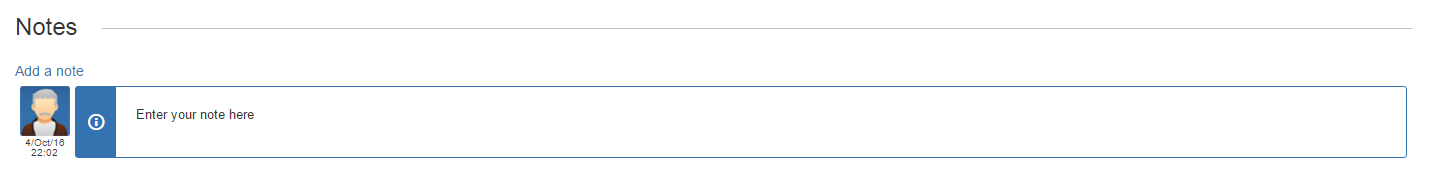
Your note will be added to the folio.
Compact View
The Overview screen can be toggled between two views: normal (single column) or compact (two columns). Toggling between normal and compact view is done by clicking the overview layout tab located at the top right of the overview.
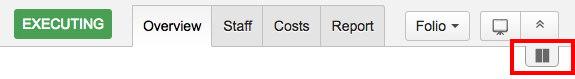
Clicking this tab changes the layout of the overview to display its section in two columns:
Clicking again on the overview layout tab switches back the layout to normal, single column view: