Sprints Scheme: Filter by Issues
When Filter by Issues is applied and followed by the Projects, Boards, or Sprints filters, the filtering process is the following:
-
Boards are loaded and filtered based on the selected Projects filter.
-
Boards are loaded and filtered based on the selected Boards filter.
-
All unique boards from previous filtered sets are combined into a single list.
-
The Issues linked to the filtered boards by JQL are loaded.
-
Then Sprints are loaded based on the issues list and filtered according to the Sprints filter.
-
The chart data is exported page by page with the corresponding unique combinations of sprints and issues.
-
When you filter by Projects, the exported table displays unique combinations of sprints and boards.

-
When you add filter by Boards (meaning a board from another project):
-
The table includes additional rows for unique sprint–board combinations from the selected board.
-
In other words, results from both filters are combined - the list expands to include all unique combinations across the chosen projects and boards.
-
-
When you apply the Sprints filter after the Projects and Boards filters:
-
The table displays unique sprint–board combinations associated with the selected sprint.
-
-
In this case, the Sprints filter narrows the results rather than combining them.
-
As a result, the amount of exported data is reduced.
-
Sprints Scheme: Filter by Parent Boards
When filter by Parent Board schema is applied and followed by the Projects, Boards and Sprints filters, the filtering process is the following:
-
Boards are loaded and filtered based on the selected Projects filter.
-
Boards are loaded and filtered based on the selected Boards filter.
-
All unique boards from previous filtered sets are combined into a single list and considered as PARENT boards list.
-
Then Sprints are loaded and filtered based on the link Sprint Origin Board = Parent Board.
-
All unique sprints from the previous filtered set are combined into a single list and filtered by Sprints filter.
-
The chart data is exported page by page with the corresponding unique combinations of sprints and issues.
-
When you apply filter by Projects, the exported table displays unique combinations of issues and sprints.
-
Boards are loaded based on the chosen project:
-
If each board contains a different set of issues, the table shows a list of all boards.
-
If all boards share the same set of issues, only unique issues per board are displayed.
-
-
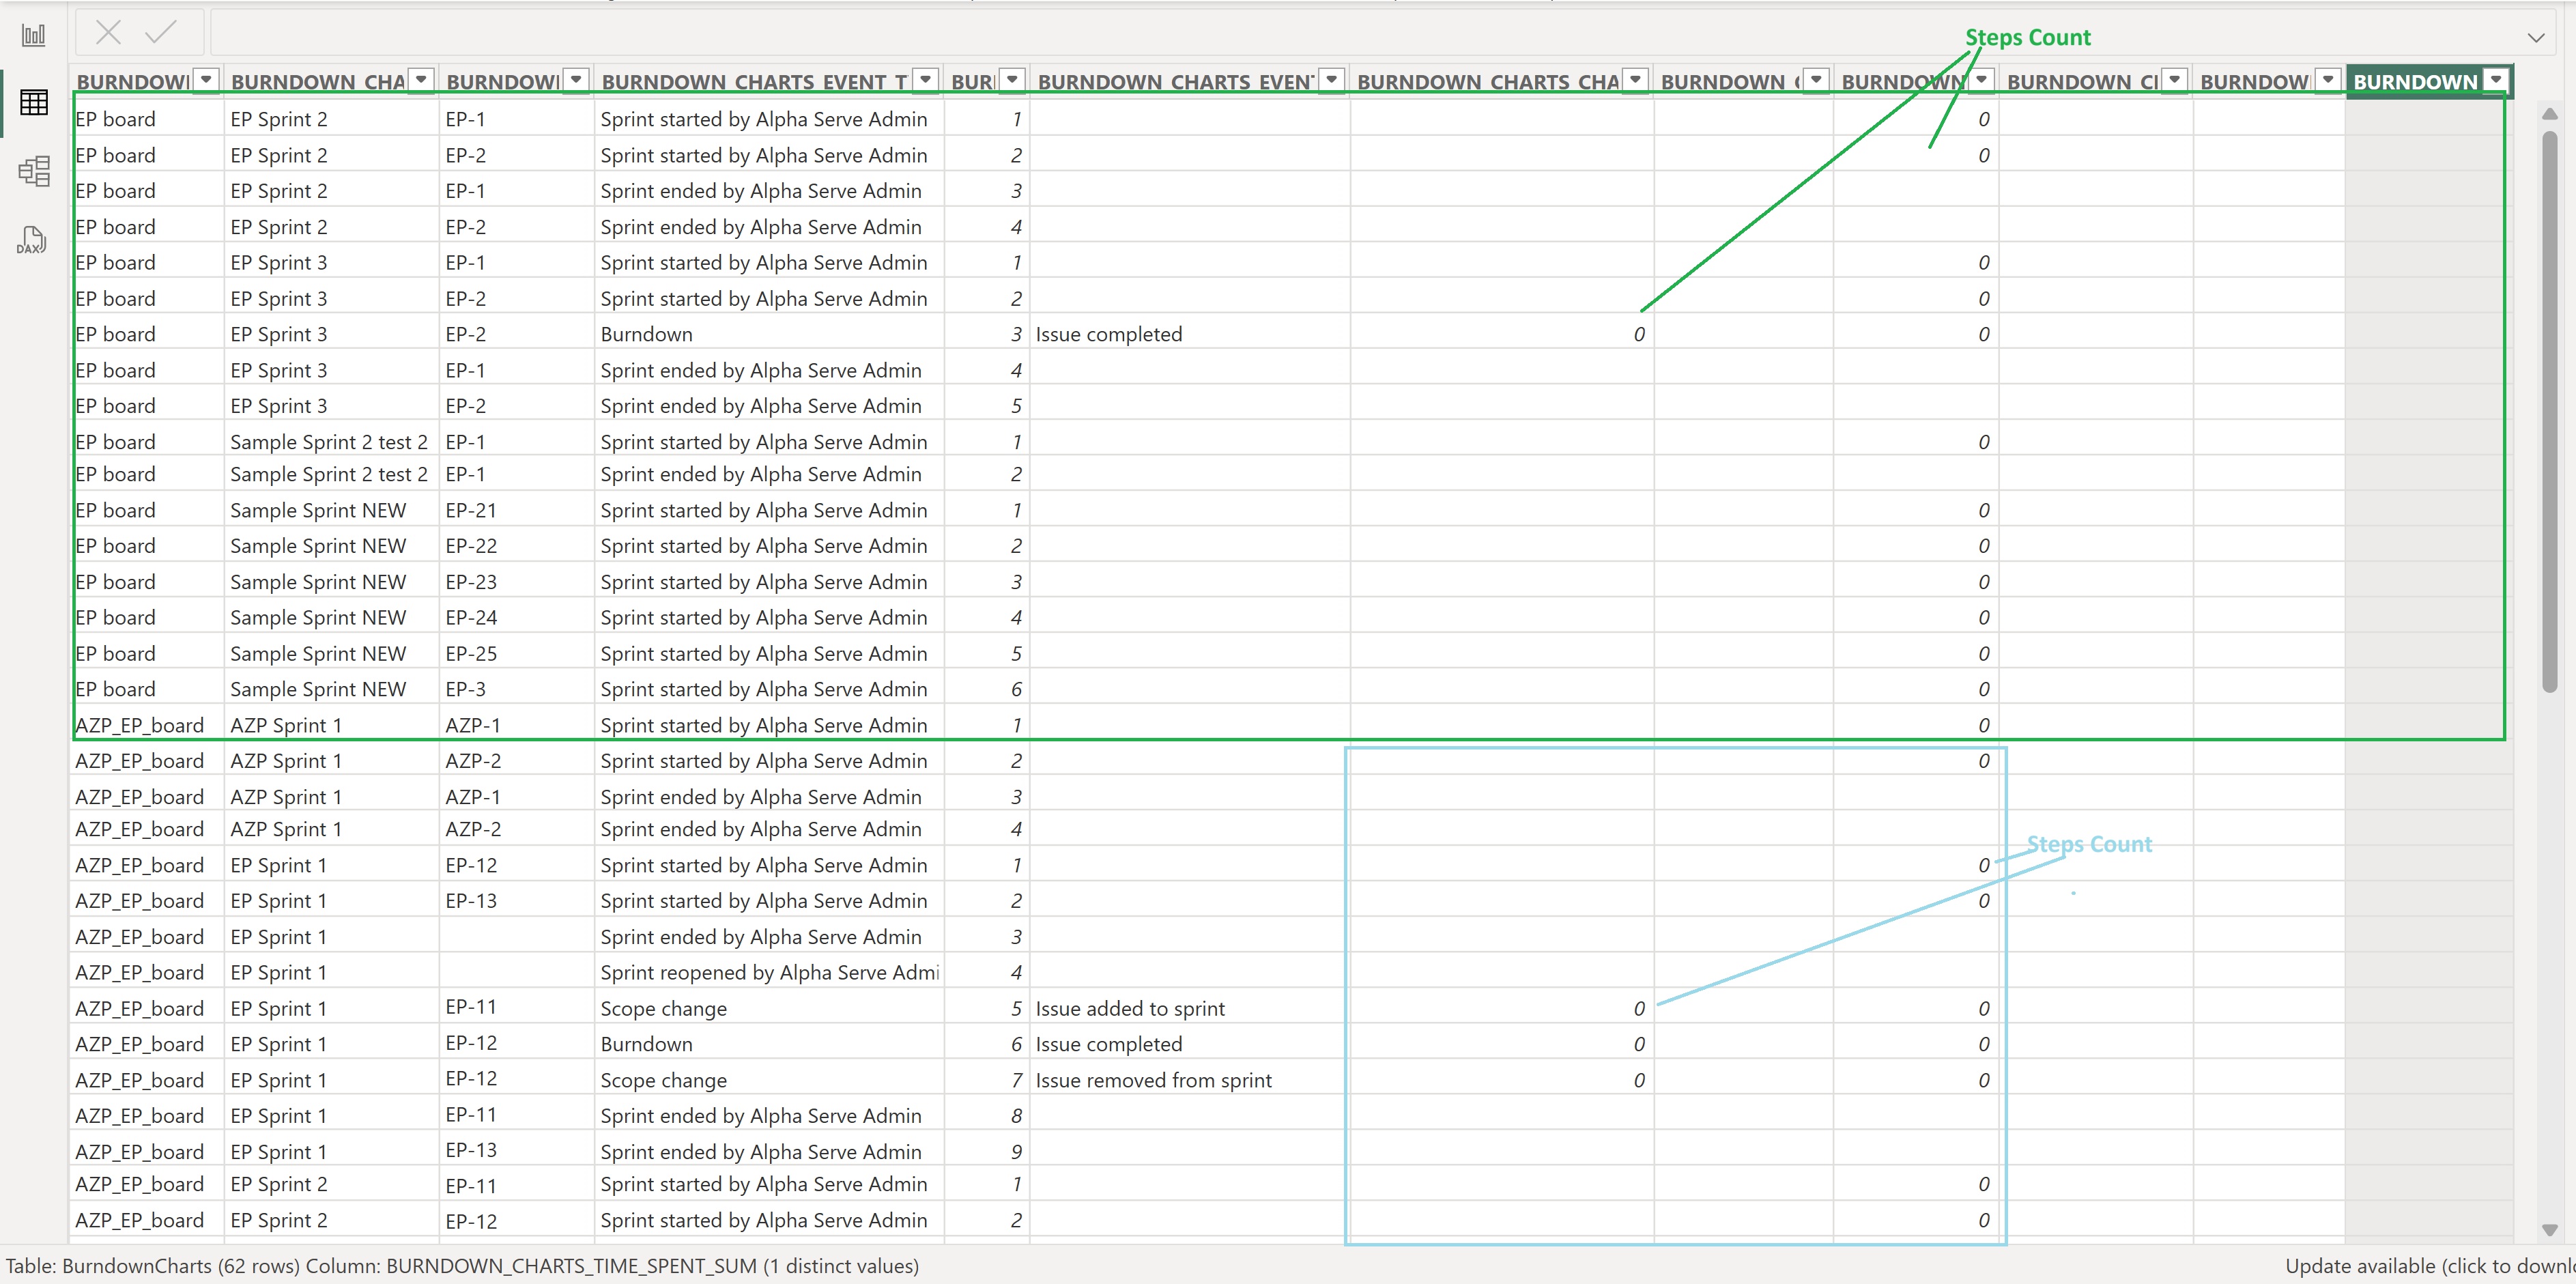
In the provided example:
-
The selected project contains four issues.
-
Two issues are not linked to any sprint and therefore aren’t shown.
-
The remaining two issues belong to the same sprint, but are in different states on the Burndown chart.
-
Not all issues linked to your project are part of sprints. If an issue is not related to any sprint, it won’t be included in the exported table.
-
Then, if you apply the Boards filter (meaning a board from another project), the table expands to include a list of unique sprints with their related issues from the selected boards.
-
When you apply the Sprints filter, it refines the results from the Projects and Boards filters.
-
The exported table shows only data related to the selected sprint.
-
-
As a result, combining filters narrows the dataset and reduces the amount of exported data.
Exporting Empty Sprints Based on the Sprints Schema Filter
The following sprint types are treated as empty:
-
Sprint 1: No linked issues; sprint not started.
-
Sprint 2: No linked issues; sprint was started and then closed.
-
Sprint 3: No linked issues; issues were removed; sprint was started and then closed.
The filtering behavior is the same as described earlier.
Consider the following behavior:
-
When applying Sprint Schema: Filter by Issues, the export result will be empty because no sprints contain linked issues. As a result, there is no Burndown Chart data to display.
-
When applying Sprint Schema: Filter By Parent Board, the export includes Sprint 2 and Sprint 3, because both are linked to the parent board.
-
Sprint 3: Shows started and closed actions, and removed issue actions.
-
Sprint 2: Shows started and closed actions.
-
Sprint 1: Not included because it is a future-type sprint, which is excluded from the export.
-
Statistics Filter
-
The Statistics filter applies only to the Burndown Charts table.
-
It allows you to choose which estimation statistics to include to the exported data.
-
-
The list of available statistics is generated from:
-
The Estimation Statistics defined on the Board configuration page.
-
The Remaining Estimate and Time Spent time-tracking types.
-
The following examples show how different estimation statistics affect the export results.
-
If the Statistics filter is not applied, the Burndown Charts table is exported using the estimation type defined in the Board configuration.
-
When the Statistics filter is applied, the Burndown Charts table is exported using the selected estimation statistics.
-
In this case, the board configuration settings are ignored.
-