Viewing the worklog distribution of other users requires the View All Worklogs permission for the Jira projects in the filter being used.
The Worklog Distribution gadget helps you to analyse or get an overview of worklog distribution. You can view the data in a column or pie chart.
Please note that none of the Tempo Gadgets can be used in Confluence.
For information about how to add the gadget to your Jira dashboard, see Tempo Gadgets.
To configure the Worklog Distribution gadget:
-
Go to your Jira dashboard and click … in the top-right corner of the Worklog Distribution gadget.
-
Select Edit.
-
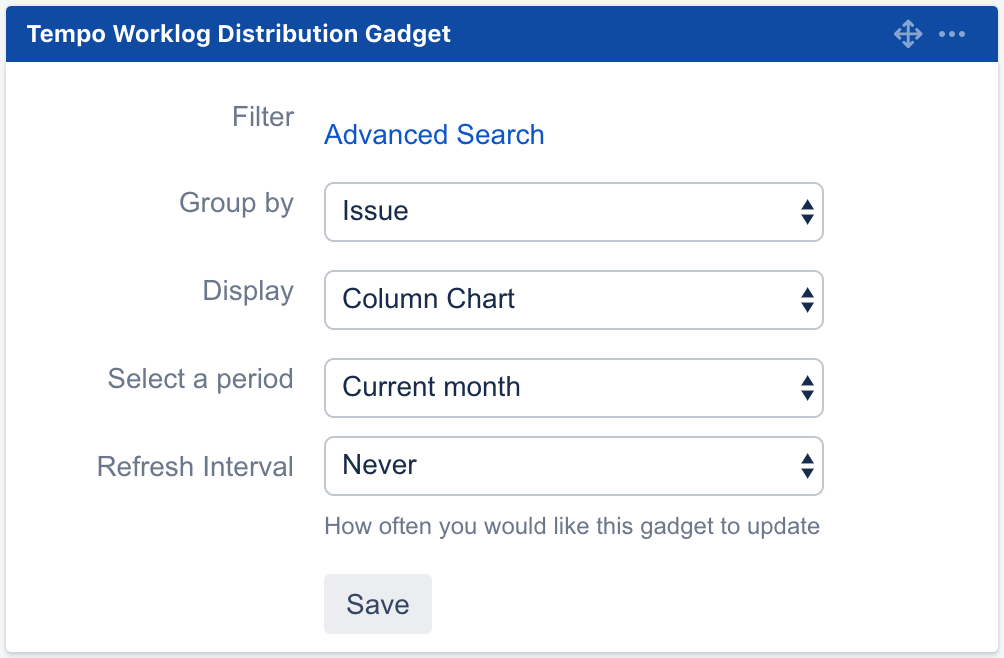
Edit the gadget configuration:
-
Filter – All available Jira issue filters.
-
Group by – Select how the information should be grouped.
-
Display – Select the chart type to illustrate the data in the most meaningful way to you.
-
Period – Select the time period you want to display.
-
Refresh interval - Select how often you would like this gadget to be updated.
-
-
Click Save to display the results in a graph.
Related Topics