This feature is only available to Collaborators, User Managers, and Account Administrators.
Customize the Time-Based Pivot in a Timeline
There are several ways you can customize the time pivot on a Timeline. You can adjust the Timeline's scale and date range, set the Timeline's time period indicators, and set other date preferences such as date and year labels. In addition to customizing a Timeline's time pivot, you can add theme-based data pivots and format the Timeline's layout and colors.
Adjusting the Time Slider and Range
Since a Timeline is a time-oriented visualization of a Roadmap, one of its main components is the time range represented by the horizontal Time Slider along the top.
Adjust the Time Slider
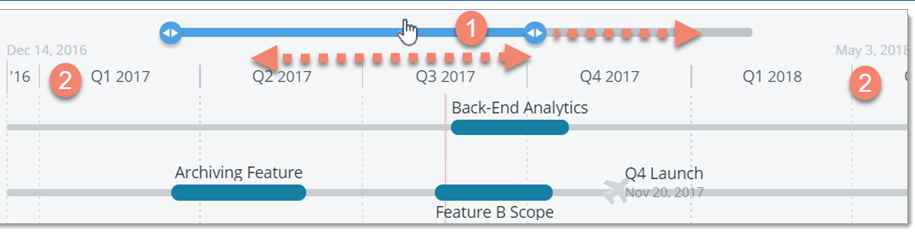
The Time Slider determines the time range that is visible on the screen.
-
Drag and drop the Time Slider above the Timeline, or expand/minimize the handles on either to zoom in or out on the Timeline. As you drag the slider, the dates at either end of the timeline change.
-
To more precisely set the range, click each date to select and exact Start Date and End Date in the date picker.
Adjust the Timeline's Date Range
In addition to adjusting the Time Slider, you can limit the date range of the entire timeline by setting its start and end dates. A Timeline's date range determines 1) The Items that are included in a Timeline (only those within the set date range), and 2) The outer limits of the Time Slider.
To set the date range:
1. Open the Format panel and select Dates.
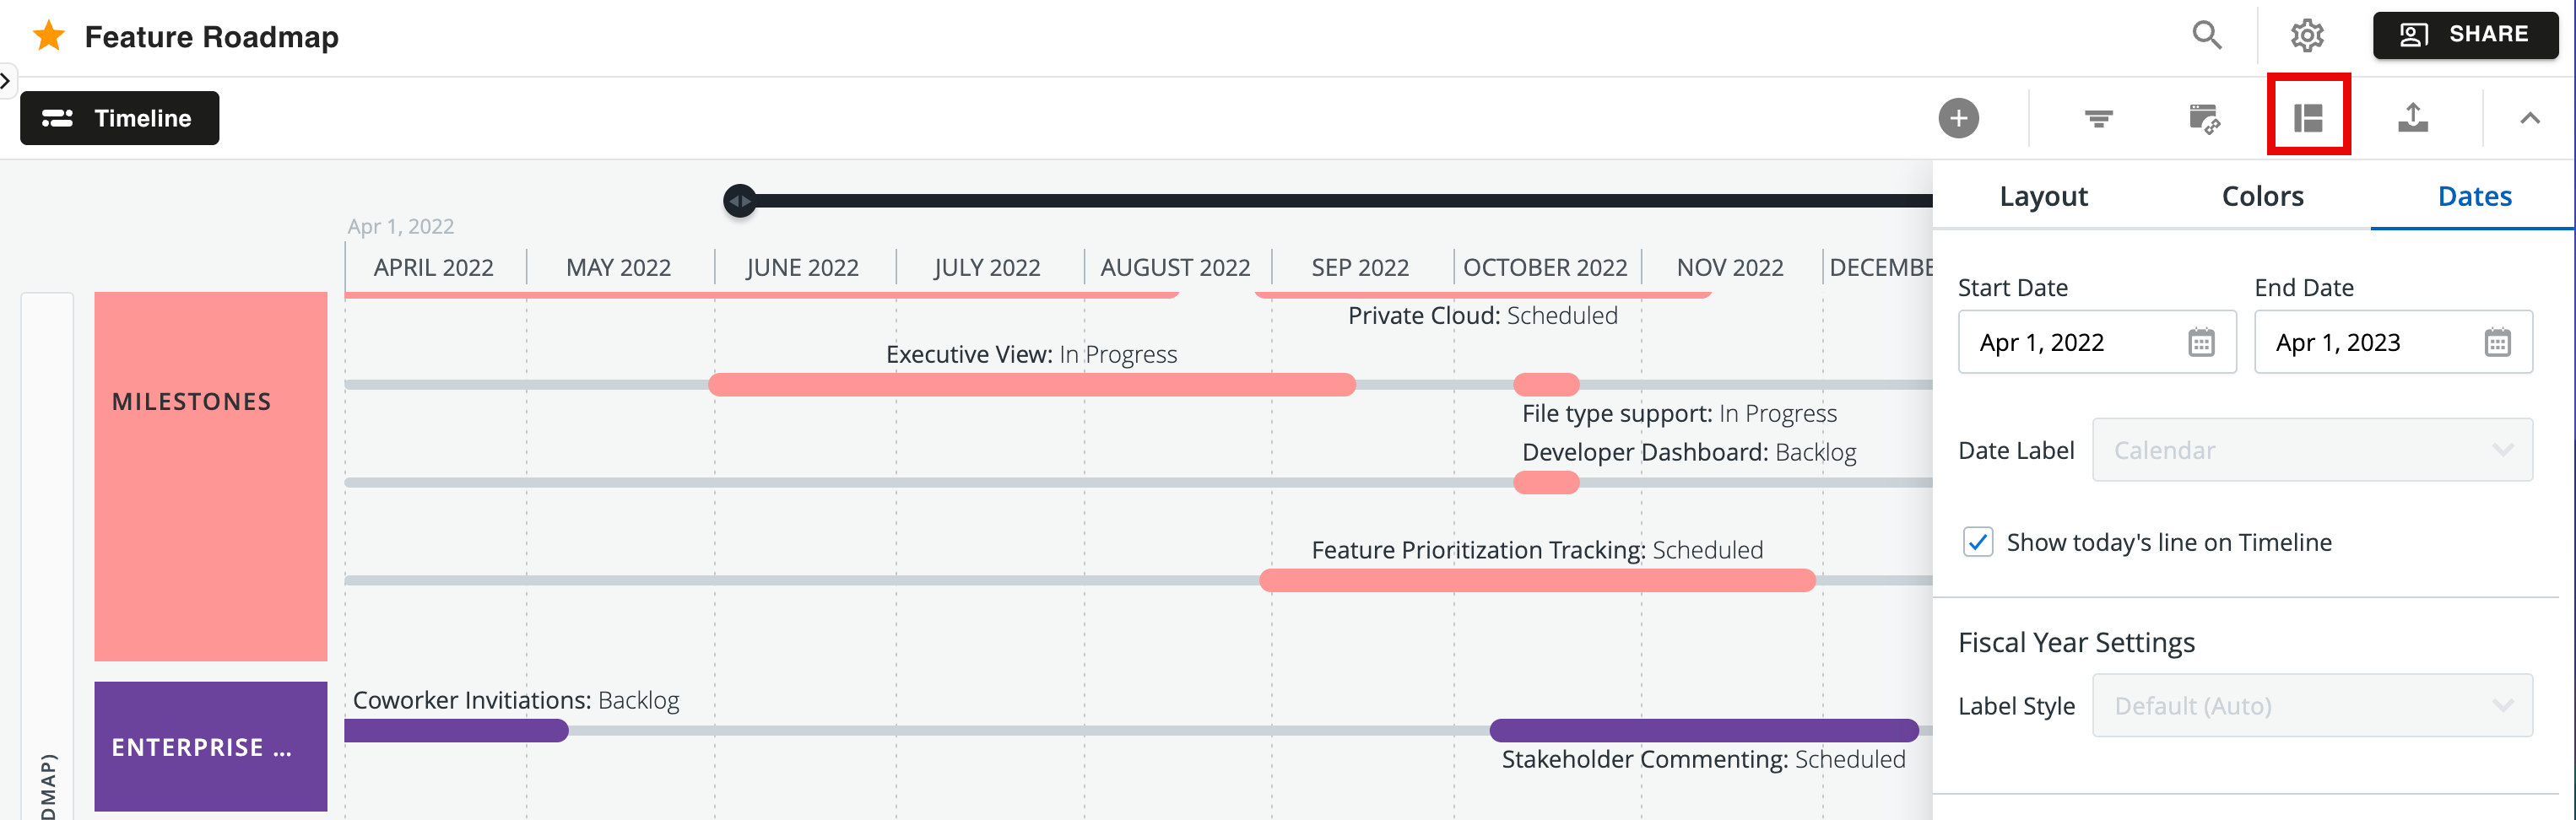
2. Select a Start Date and an End Date.
Strategic Roadmaps supports roadmaps that extend to 2050. Before setting the date range, take a look at how it affects the time periods you can display on the Timeline.
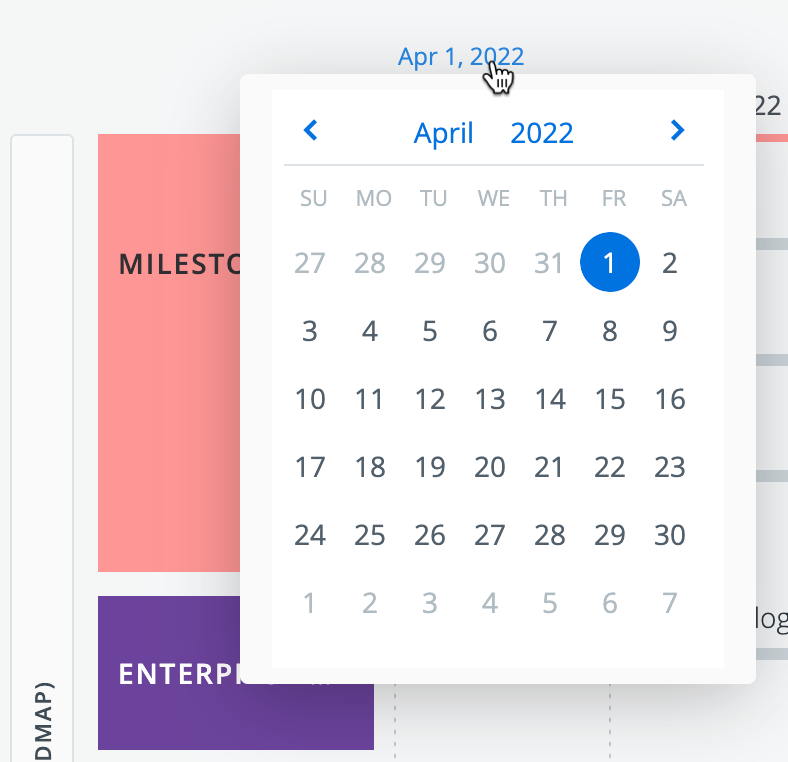
You can also adjust the Start Date or End Date from the timeline. Just click either date to make an adjustment.
Setting the Timeline's Time Period Indicators
Timelines are split into time period indicators that are labeled along the top and extend downwards as dotted vertical lines. Today's date, if it's within the timeline's scale, appears as a vertical red line.
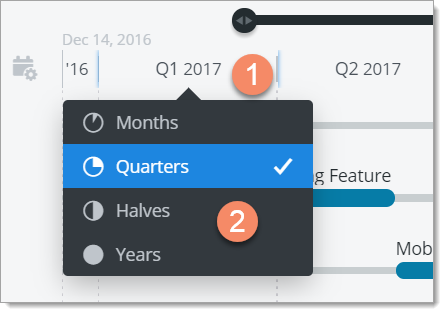
You can set each time indicator in the timeline to a different period: Months, Quarters, Halves, or Years. Which time periods you select will depend on the scale of the Timeline and the degree of detail that you want.
Set a Time Period Indicator
-
On the timeline, click the time period indicator you want to set.
-
In the dropdown, select the time period: Months, Quarters, Halves, or Years.
Mouse over each selection to see how it will affect the appearance of the timeline.
Time Periods and the Timeline date range
A timeline's date range (see above) determines which time periods you can display on the timeline.
-
Weeks: less than two years
-
Months: less than five years
-
Quarters: less than eight years
-
Halves: less than 15 years
Setting Other Date Preferences
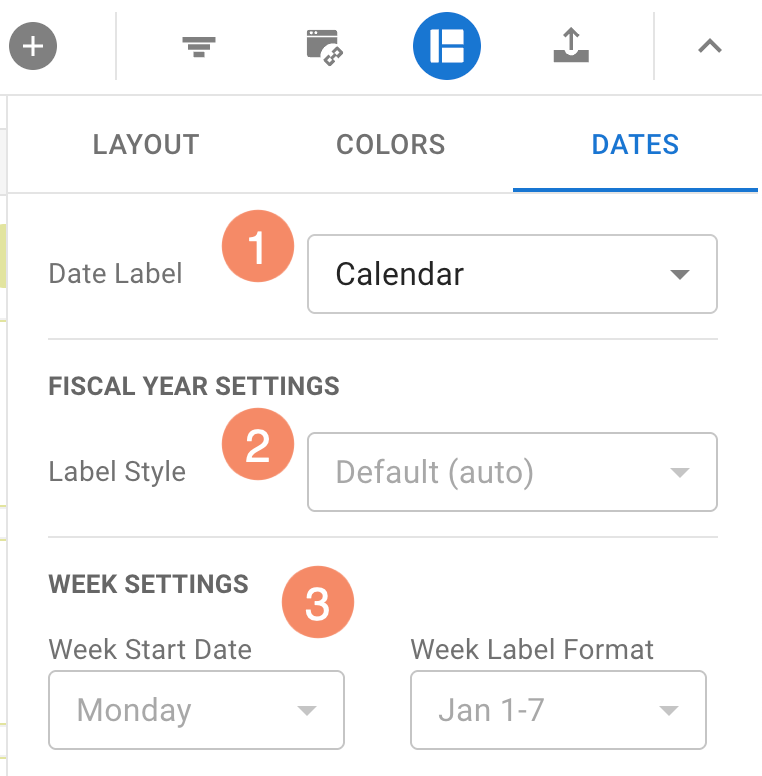
You can set other date preferences in Format | Dates.
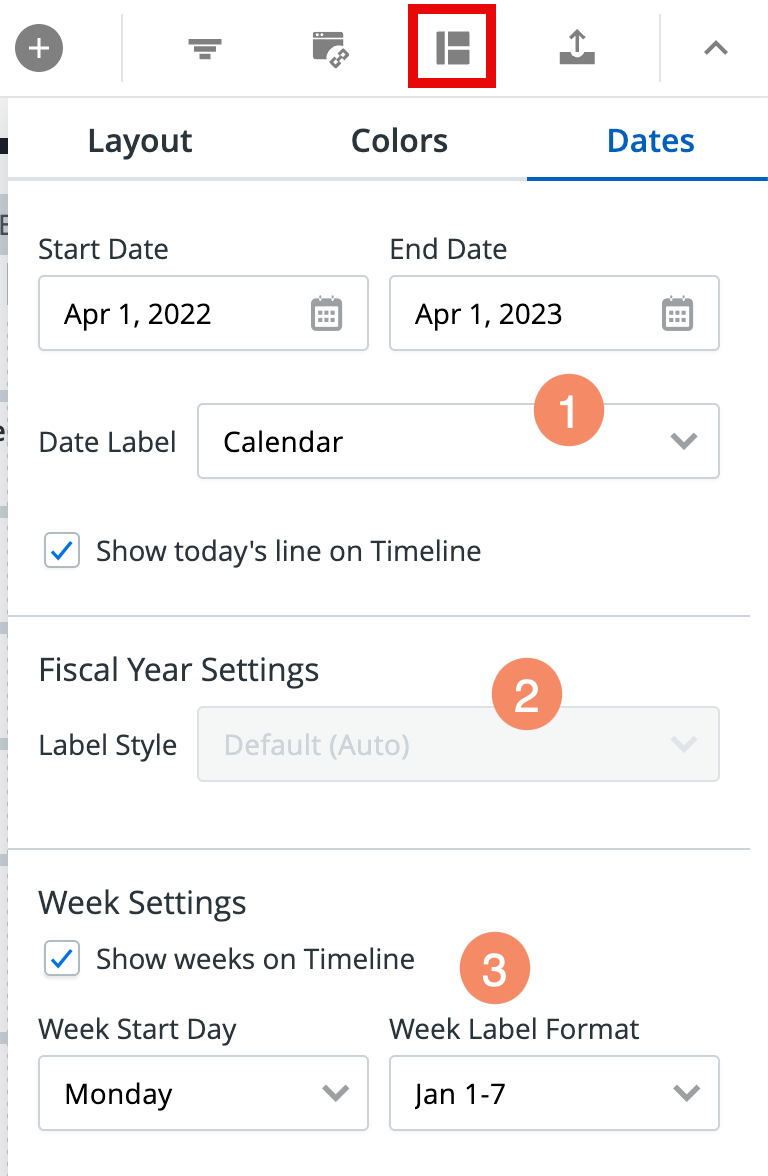
1. Label time periods using Calendar Year of Fiscal Year
If your roadmap has a Fiscal Year-End, you can label the time periods in a Timeline using the Calendar Year or the Fiscal Year. If you select Fiscal Year, the Items on the Timeline keep their Calendar Year dates but are plotted on the Timeline in relation to the Fiscal Year.
To set the label, select Calendar or Fiscal in the Date Label dropdown.
If your roadmap has a Calendar Year-End, this option is not available, and the dropdown will be grayed out.
2. Set the format of Fiscal Year labels
If your roadmap has a Fiscal Year-end and you choose to label time periods using the Fiscal Year, you can set the format of the labels (FY 2017-2018, FY 2018, FY18, etc.).
To set the format, select it in the Label Style dropdown under Fiscal Year Settings.
If your roadmap has a Calendar Year-End, this option is not available, and the dropdown will be grayed out.
3. Show Weeks on the Timeline
If your Timeline's date range is less than two years, you can choose to show weeks.
-
Under Week Settings, select Show weeks on timeline.
-
Select the day to start weeks on in the Week Start Day dropdown.
-
Select the format of weeks in the timeline in the Week Label Format dropdown
Customize the Time-Based Pivot in a Swimlane
When you add a Swimlane to a view, it begins with a time-based horizontal pivot, with the column headers set to Months. You can change the time period of the columns to Weeks, Quarters, Halves, or Years.
You can also set the column headers to any Field in the roadmap in order to create a theme-based pivot instead. To see how, go to Add theme-based pivots to a Swimlane.
If you set a Swimlane's column Headers to a Field, you can choose to make the vertical pivot a time-based pivot by setting the row headers to a time period, the same way you do the column headers.
Changing the Column or Row Header Time Period
-
On the View navbar, click the Format icon.
-
In the Layout tab, click the Column Header or Row Header dropdown.
-
In the dropdown, select Change Column Header.
-
Select Use Item Dates.
-
Select the Item Start or Item End time period (Weeks, Months, Quarters, Halves, Years).
NOTE: You can set only one of the headers to a time period. If one of the headers is already set to a Date, the Default Dates selections in the other header's dropdown will be grayed out. -
Click the Format icon to close the panel.
Setting Other Data Preferences
You can further customize a Swimlane's time-based pivot using the Dates format.
To open the dialog, open the Format panel and select Dates. When you're done setting your preferences, click the Save button at the bottom of the dialog.
The icon is visible only if one of the Swimlane's headers is set to a time period.
1. Label Time Periods using Calendar Year of Fiscal Year
If your roadmap has a Fiscal Year-End, you can label the time periods in a Swimlane's column or row headers using the Calendar Year or the Fiscal Year.
To set the label, select Calendar or Fiscal in the Date Label dropdown.
If your roadmap has a Calendar Year-End, this option is not available, and the dropdown will be grayed out.
2. Set the format of Fiscal Year labels
If your roadmap has a Fiscal Year-end and you choose to label time periods in a Swimlane's column or row headers using the Fiscal Year, you can set the format of the labels (FY 2017-2018, FY 2018, FY18, etc.).
To set the format, select it in the Label Style dropdown under Fiscal Year Settings.
If your roadmap has a Calendar Year-End, this option is not available, and the dropdown will be grayed out.
3. Show weeks on the Swimlane
If you've set a Swimlane's column or row header to Weeks, you can choose the week start day and the format of the week label.
-
To set the week start day, select it in the Week Start Day dropdown.
-
To set the label format, select it in the Week Label Format dropdown.