The time required for data export depends on the amount of data selected. In most cases, exports take just a few minutes, but larger datasets - such as those with thousands of rows - can take significantly longer, sometimes even hours.
While there is no universal solution for optimizing export time, the following best practices can help speed up the process.
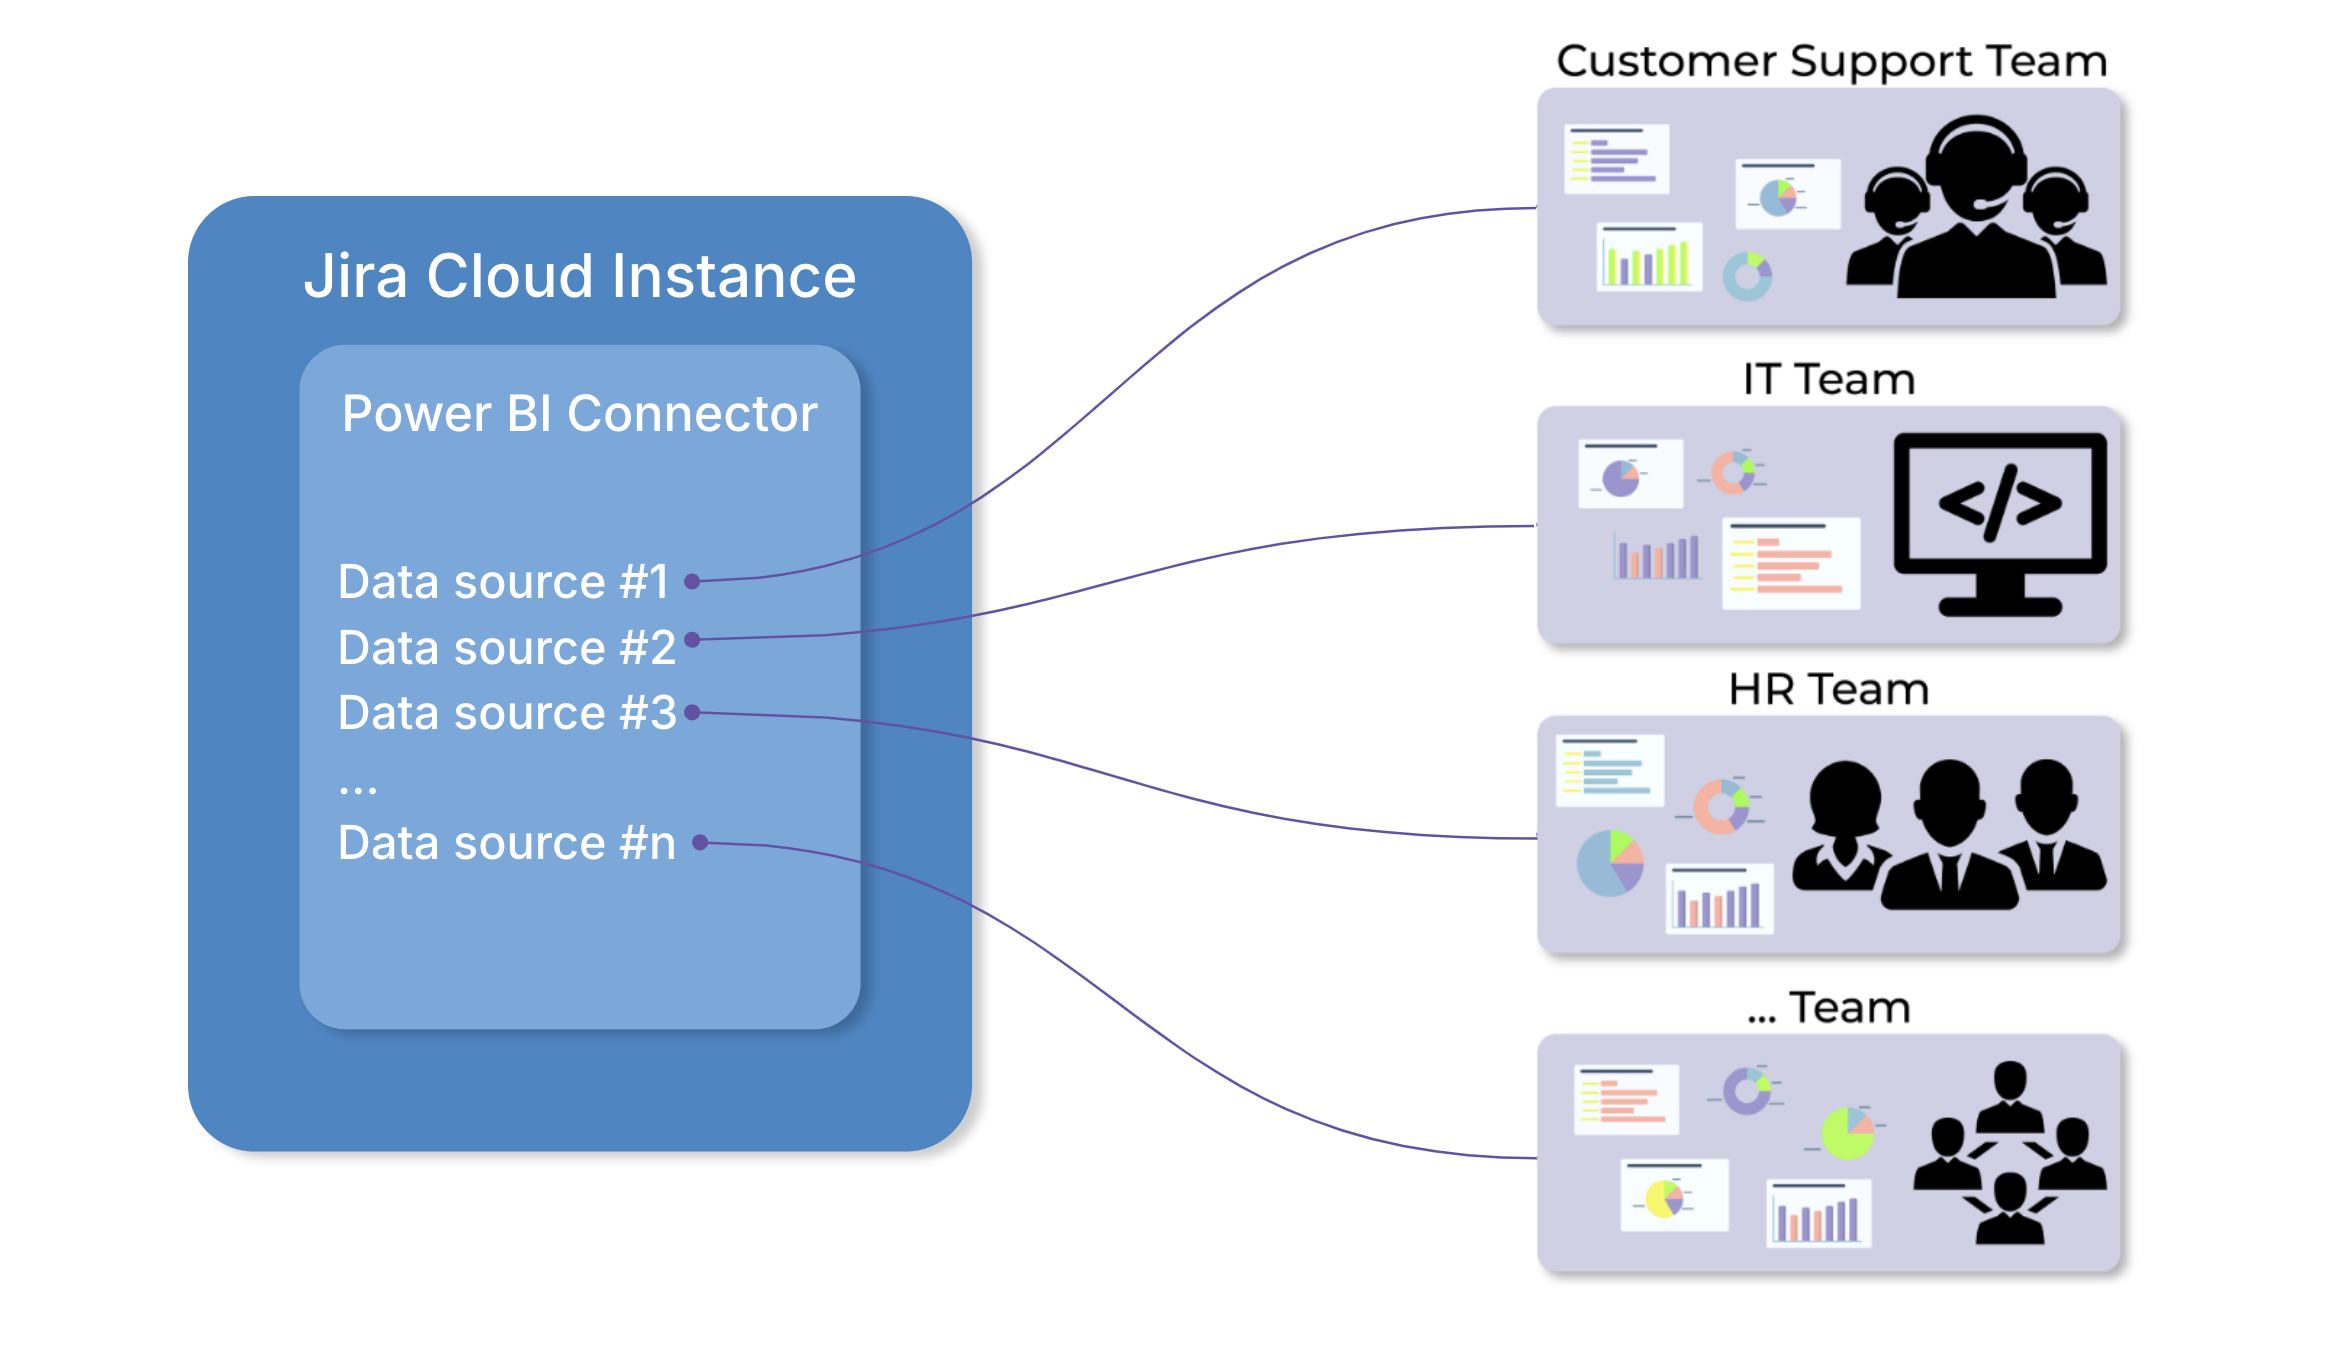
Break up data source into smaller parts
Data Source is the initial source of data sets that contain tables and fields for further analysis. Generally it can be defined as a number of data that user selects for export to Microsoft Power BI.
Each data source can contain different data based on your exporting requirements and the data you need in Power BI to build a certain report.
You can create as many Data Sources as you need. Their number is not limited by the app.
Example
Every team uses different Jira tools in their daily operations and requires unique reports to track relevant metrics. We recommend creating a separate data source for each Power BI report or dashboard. This data source should include only the necessary tables and fields for that specific report.
Useful links 🔗
Apply filters to reduce queried data
To optimize export speed and reduce data volume, Power BI Connector for Jira Cloud provides various global and local filters. These filters help refine your data selection, ensuring you only export the information you truly need.
Here are a few ways to apply filters effectively:
-
Create a data source that includes information from a specific project. You can also set up separate data sources for different projects.
-
Use the ‘Created-Updated’ filter to export data only for a certain time period, reducing unnecessary rows.
-
Apply JQL filter to search for specific issues, projects, or other data points in Jira. This advanced option allows you to create custom queries and extract exactly what you need.
Useful links 🔗
Consider heavy tables
Some tables naturally take longer to export due to the large volume of data they contain. For example, exporting tables like Histories and Issue Worklogs can significantly increase export time.
To improve performance, consider the following best practices:
-
Reduce the data load by filtering these tables by project, issue status, or other relevant criteria.
-
Instead of exporting all data at once, split it into multiple data sources based on specific needs.
-
Include only the fields essential for your reporting to speed up the process.
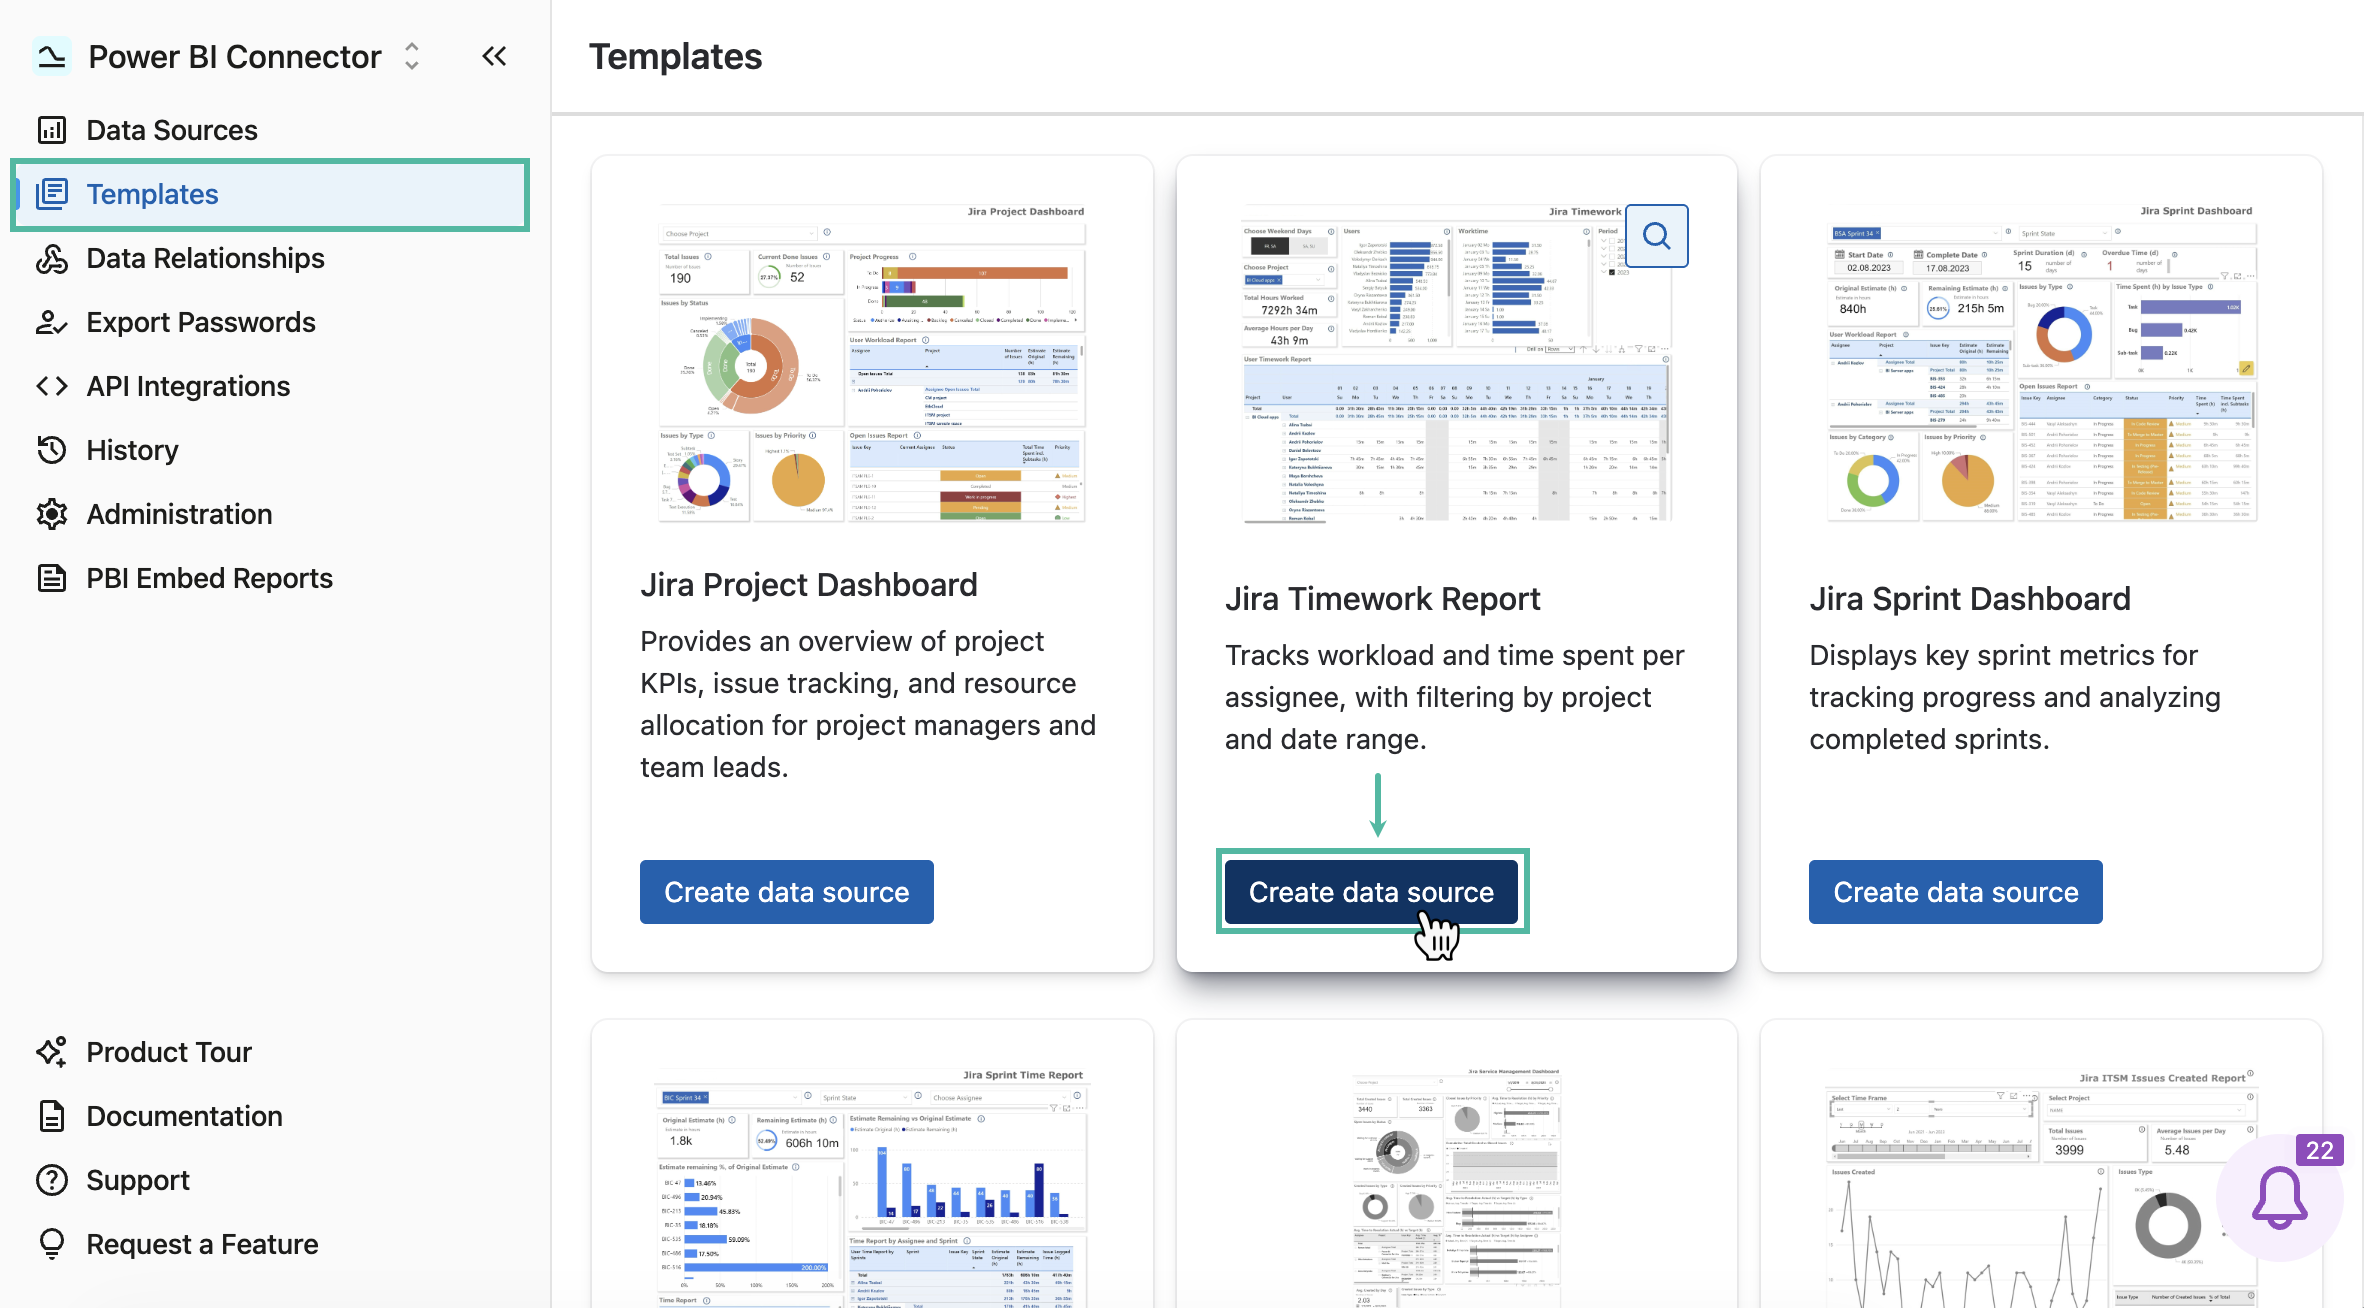
Use Power BI dashboard templates
Power BI dashboard template offers pre-configured data sources for advanced reporting. This means users don’t have to manually select fields or apply filters - the template comes with all the necessary settings already in place, making the setup process quick and effortless.
Useful links 🔗
Use Cases
In a single organization, you may solve multiple tasks with the Power BI Jira Connector. To maintain performance, it is recommended to create a separate data source for each task.
Here are some examples of such tasks:
-
Track team progress: As a project lead, see how many tasks the team completed in each sprint.
-
Measure individual contribution: For each project member, track how many specific epics they completed.
-
Monitor requests: As a project manager, view how many requests made to teams were managed.
-
Analyze backlog: As a project lead, check how many days items remain in the backlog.
-
Review project status: As a project administrator, see the status of all projects across Jira.
Each task usually requires a unique dataset. For example, a data source for tracking sprint progress may use data from Project A, while a data source for monitoring requests may use data from Project B. For this reason, it is logical to filter each data source according to the requirements of the task.