The Timespent report for Jira Server and Data Center provides a way to analyze workload with a classic sheet view displaying a time spent column. With numerous filters and options, you can display many variations of the report. For example, use the Pivot by Field option to spread out time spent by the field value at the moment the worklog started.
|
Element |
What is it? |
What can I do with it? |
|---|---|---|
|
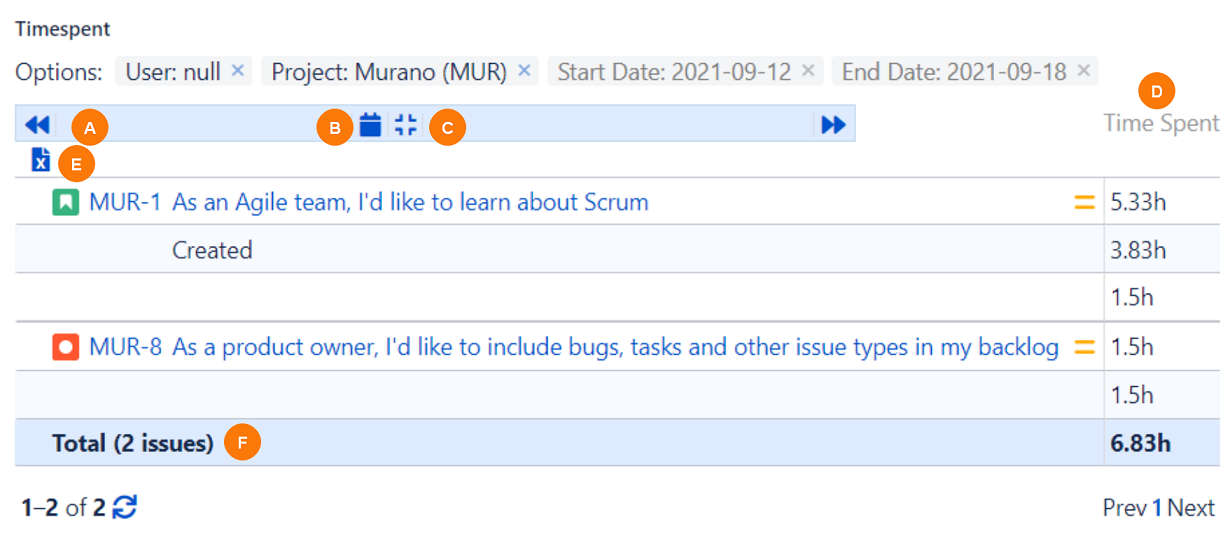
A |
Previous and Next icons |
Click to scroll to the previous or next week. |
|
B |
Worked Hours icon |
Select whether to display the daily, weekly, or monthly worked hours. |
|
C |
Details icon |
Select whether to show or hide every worklog. When set to Hide, entries are grouped by issue. |
|
D |
Time Spent column |
Displays the time spent per issue. If Show Details is selected, you can see the time spent for each worklog in an issue. |
|
E |
Download icon |
Click to export the report. See Exporting and Importing Time Reports. |
|
F |
Total row |
Displays the total time spent for all displayed issues. |