The Capacity report shows staff capacity for teams where you have the View Team Plans permission.
You need to have Tempo Capacity Planner version 7.13 installed to view the Capacity report.
The Capacity report helps you understand the planned and available capacity of employees over a given period of time. You can report on staff capacity by team, role, user, location, program, account, and project to get a clear picture of staff availability within your organization. You can, for example, use the Capacity report to view the capacity of individual roles to make sure that the organization has the right resources or view the capacity of your team and use the information to adjust the team allocation according to organizational needs.
The reports can be exported as CSV or XLS.
To access the Capacity report:
-
Go to Reports :reports_dc: and then select Capacity.
-
You can filter and group the information in the view to see the specific capacity of each location, individual, project, etc. For more information about how to filter and group report data, see Viewing Reports - Tempo Capacity Planner for Server.
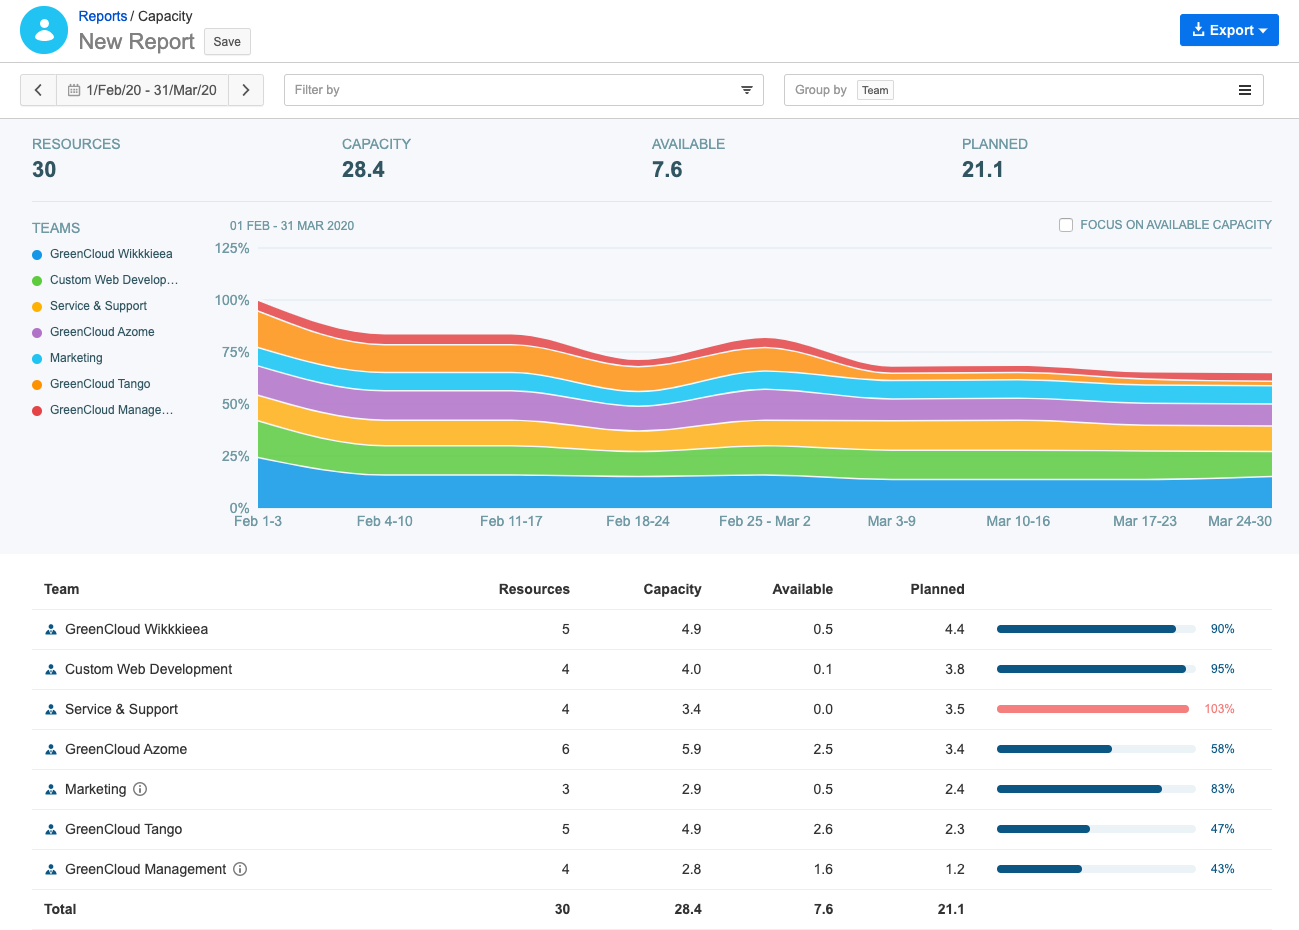
The Capacity report displays capacity calculations both as a chart and a table. You can hover over the values in the report header and Total line for explanations:
-
Resources: the total number of resources working on your projects.
-
Capacity: resource capacity in full-time equivalent (FTE) based on the organization's default workload- and holiday schemes. The FTE is calculated by dividing each employee's capacity in hours (holidays subtracted) by the hours for a full-time working week according to the default workload scheme.
-
Available: the number of FTEs available to be scheduled.
-
Planned: the total FTEs planned in the time period. The value is correlated to the Capacity.
Using the Report
-
Use filters to focus the data. Apply filters to help focus the view on few users, teams, projects, roles, and so on.
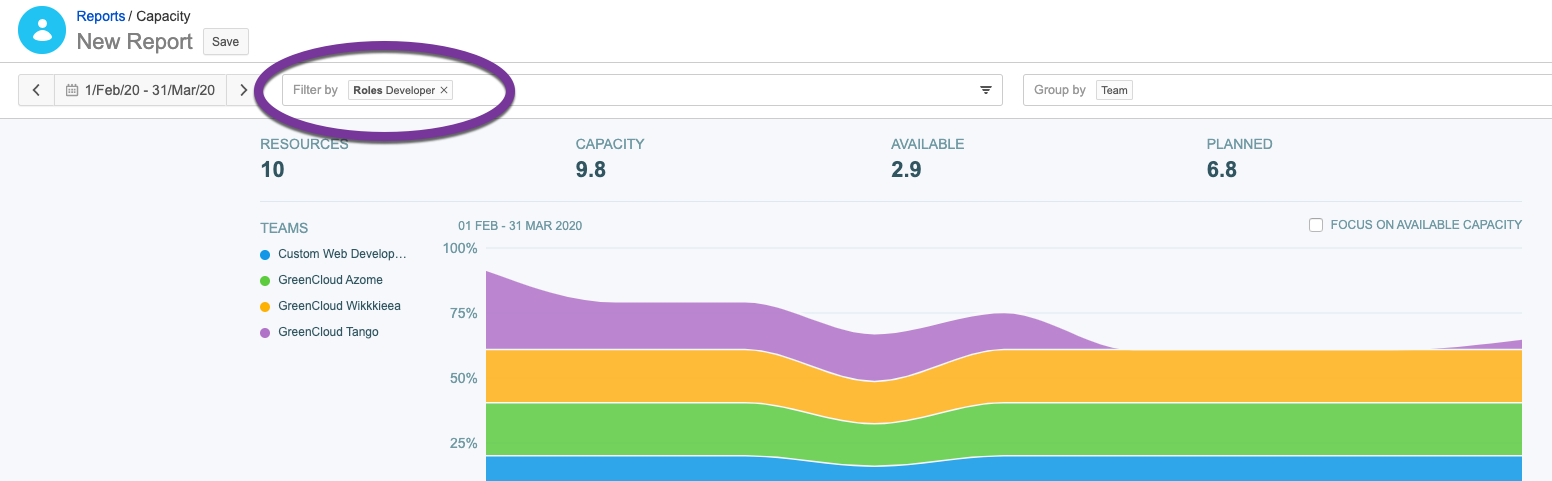
You can, for example, filter by role to see that role's capacity per team, location, project, and so on.
When you apply filters, the bars at the bottom give a sense of what has been planned for the applied filter as well as what has been planned outside your filter.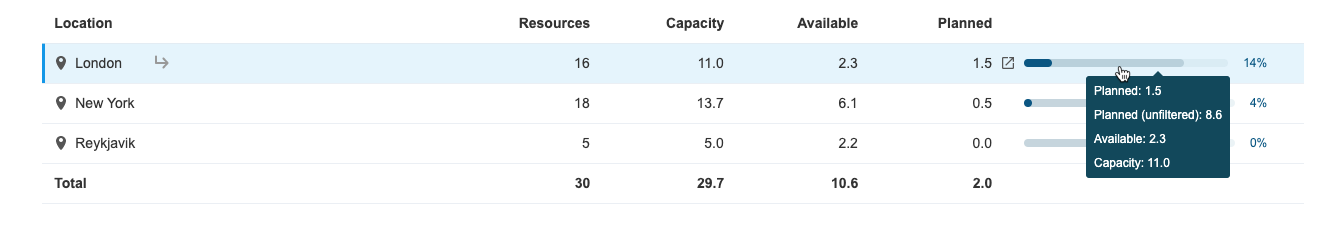
The dark color indicates planned FTEs for whatever filter is applied, 1.5 in this example for the London office. The lighter color, 8.6 in this example, shows planned FTEs outside the scope of the filter.
-
See where staff and project capacity is being used: Identify under/over utilization of resources across projects, roles/discipline and location.
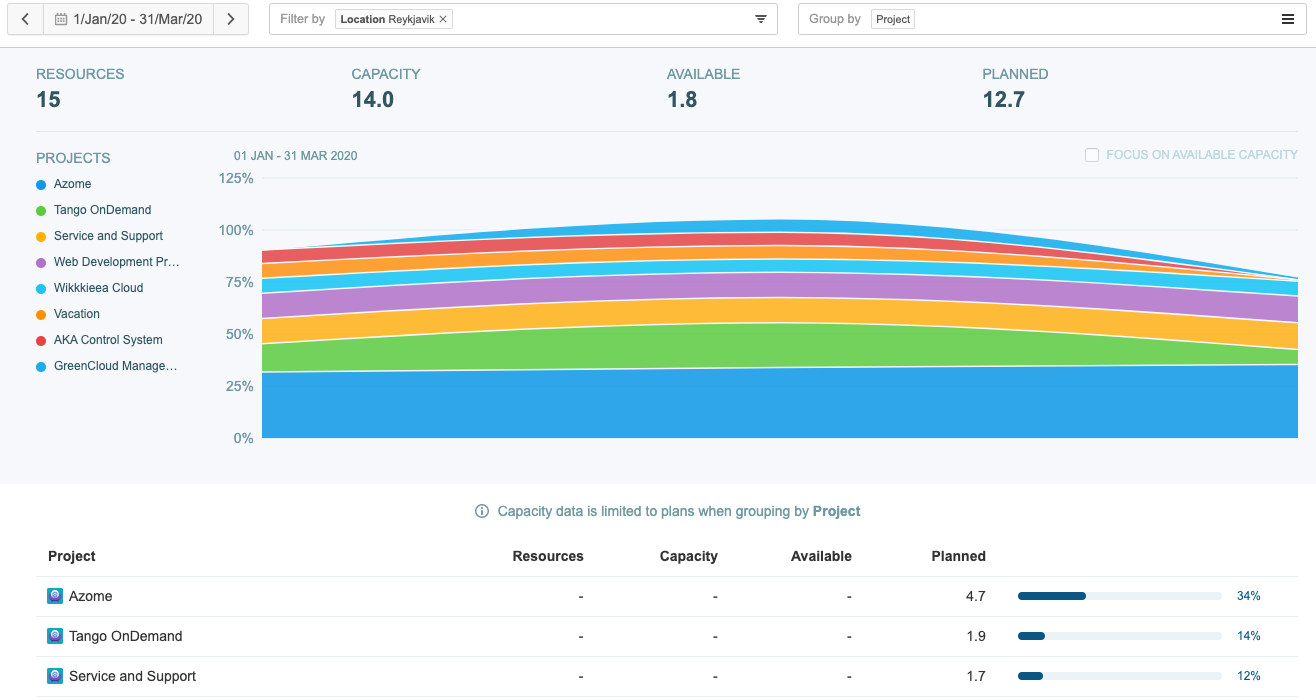
For example, you can view capacity by project to see which projects you have planned the most resources to. You can then filter by location, for example, to see projects by location. Similarly you can group by location to get a better picture of where you can add new projects.
-
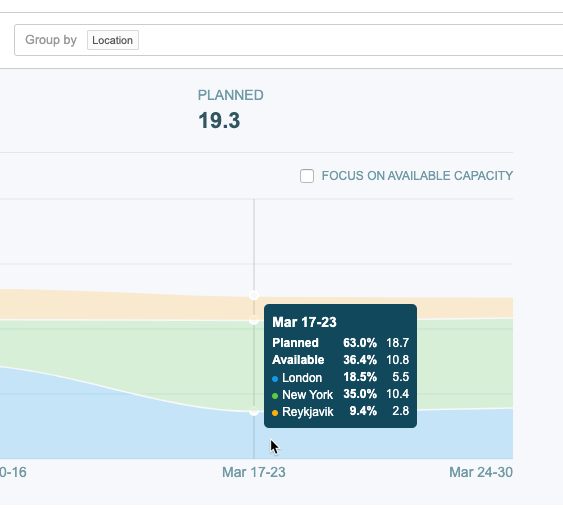
Focus on availability. It can be useful focusing the view on available capacity, for example, when you are evaluating project feasibility based on resource availability. To switch between focusing on planned or available capacity, select and clear the check-box to the upper right in the chart.
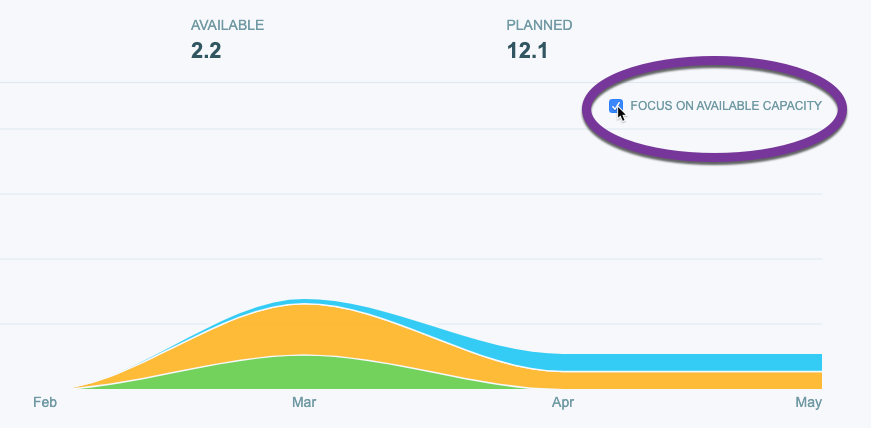
For example, if you are interested in seeing if you have enough developers available for upcoming projects, you can group the report by role and select to focus on available capacity. Filtering the view by a location helps you get a better picture of the available capacity at a certain work location.
-
Set a date range: By default, the report shows data for the current period. Use the arrows on both sides of the box to navigate to the previous or next period. To set your own date range, click inside the date box and select a pre-defined reporting period or choose a date range from the calendar. For more information about how the set a date range for reporting, see Selecting a Reporting Period.
-
View Data as Planned Time Report. To view a Planned Time report for a particular item in the Capacity Report, click

in the Planned column of the Capacity table. In the Planned Time report you can see planned FTEs as hours and you can view the data broken down in more ways than by employee.
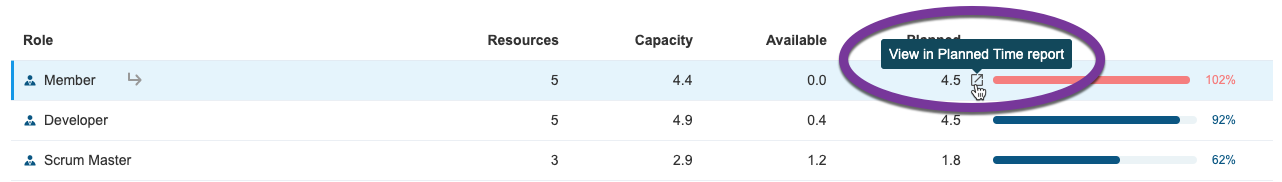
When viewing capacity by role, for example, you might want to see how planned time is broken down by employees over a given period. Filters will be carried over from the Capacity report, so if you open the Planned Time report for Role X where the Capacity report is filtered to focus on Project A, the Planned Time report will open for Role X filtered by Project A.
-
View users in a resource group: You can click the arrow to see the members behind a resource group.
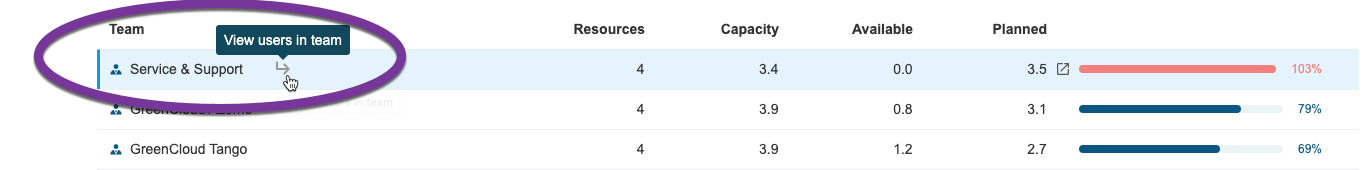
For example, when viewing capacity by team, you can drill down the data to show a capacity report for the selected team grouped by team members.
-
See where multiple team members skew the total capacity. Sometimes employees are members in more than one team which skews the total capacity. The report brings your attention to these instances so that you can take this into account in your work allocations.
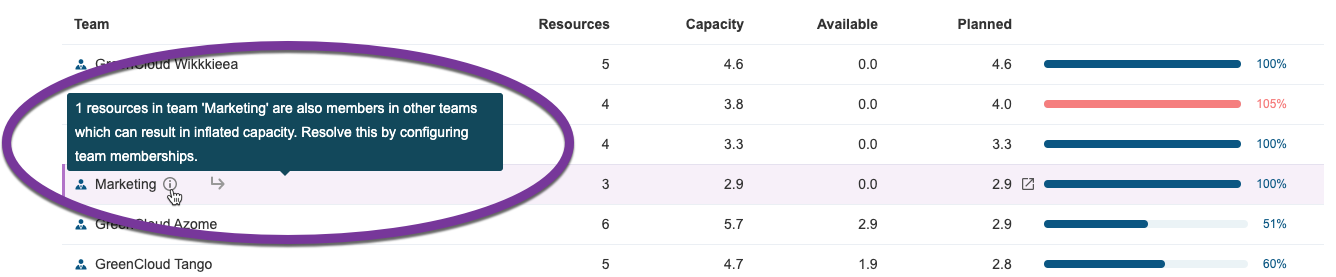
Each team membership accounts for 1 FTE. If Employee X is a member of Team A and Team B, the team member's capacity will be shown as 1 FTE in each team. If you plan time for this team member in Team A, the capacity will also change in Team B.
-
Know when too much time is planned. A red bar indicates that you are over capacity.
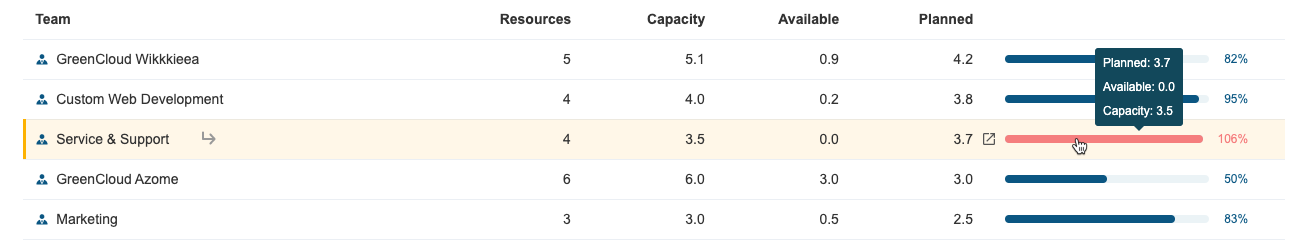
In this example, 3.7 FTEs have been planned for the Service & Support team when the team's available capacity is 3.5 FTEs. If you want to see how this breaks down by individual team members, you can click
to view planned time for the team.
-
See chart details. Hover over the chart to see details.
-
You can click the chart to highlight the corresponding entry in the table and vice versa. Selected group. Select an item to highlight it in the chart and the table. If you are viewing capacity by location, you can click on one of the locations to get a better view of