The Timesheet report for Jira Server and Data Center provides the most extensive means to analyze users' workloads. It has the classic sheet view by day, but with numerous filters and options, you can display many variations of the report. For example:
-
Use Starred Filter or Project to narrow the Timesheet report to a subset of issues.
-
Select an option in Group By Field to aggregate hours by values of the selected field in a separate section.
-
Use Sum Subtasks to sum up hours into parent issues.
|
Element |
What is it? |
What can I do with it? |
|---|---|---|
|
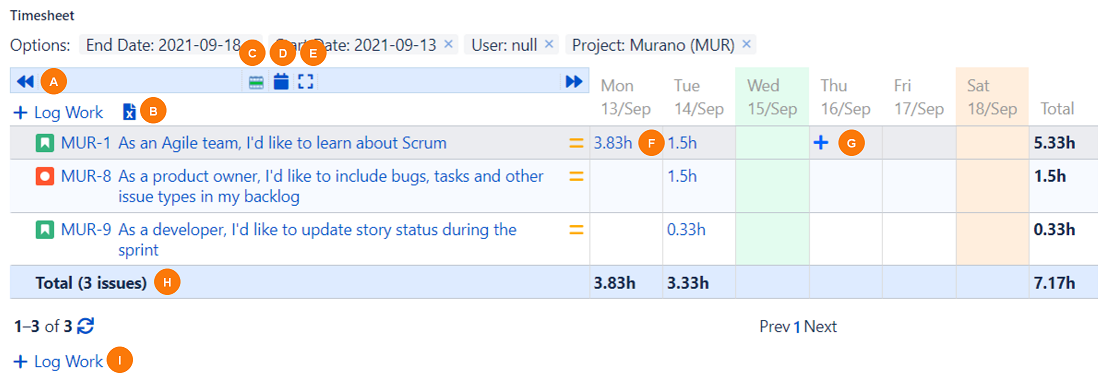
A |
Previous and Next icons |
Click to scroll to the previous or next week. |
|
B |
Export/Import icon |
Click to export the report or import timesheet data. See Exporting and Importing Reports. |
|
C |
Calendar display icon |
Select whether to show the daily worked hours or sum the hours by week. |
|
D |
Worked Hours icon |
Select whether to display the daily, weekly, or monthly worked hours. |
|
E |
Details icon |
Select whether to show or hide every worklog. When set to Hide, entries are grouped by issue. |
|
F |
Existing time entry |
If viewing your timesheet, click to edit or delete the worklog. If viewing the timesheet for multiple users, click to view who the issue is assigned to, and edit or delete the worklog, if you have the proper permissions to do so. |
|
G |
+ Log Work icon |
If viewing your timesheet, click to log work against an issue. |
|
H |
Total row |
Displays the total times for the various columns. |
|
I |
+ Log Work entry |
Click to open the Log Work Done window to log time against an issue. Also available above the timesheet. |