Team Insights is an integrated dashboard in Timesheets that provides a real-time overview of team activity, time-logging progress, and workload distribution. This visual snapshot helps managers and administrators quickly detect team utilization patterns, monitor team progress throughout the week, and uncover space workload imbalances.
Viewing Team Insights
Required Permissions
Viewing the Team Insights tab on the Teams page requires the Tempo Administrator global permission or any of the following Tempo Team permissions:
-
Manage Team
-
View Team
-
Approve Timesheets
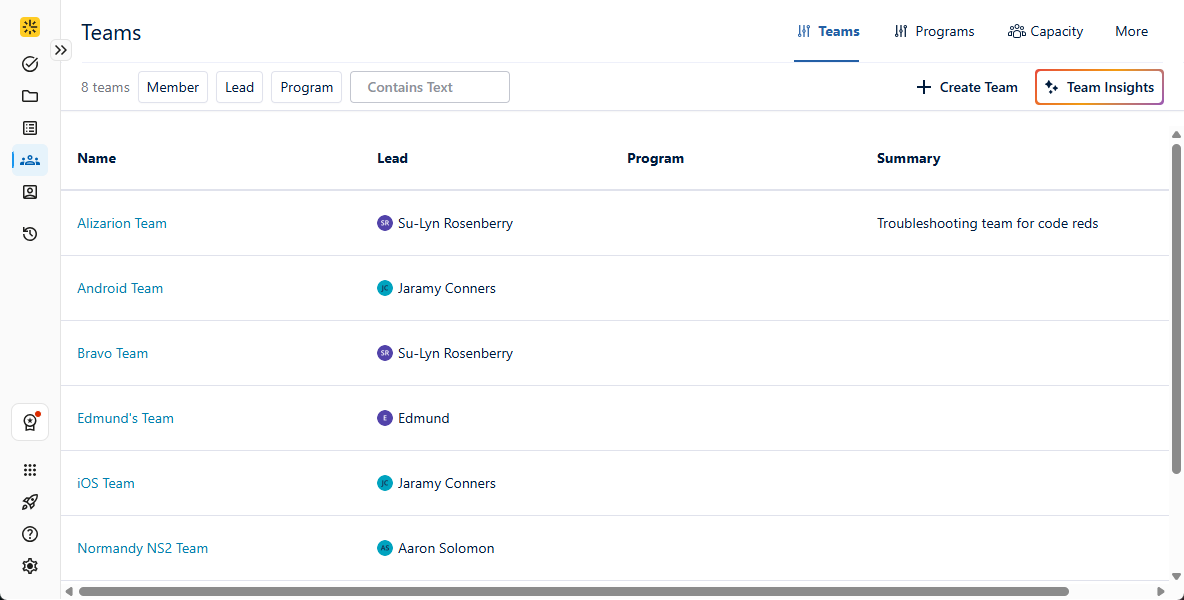
To view Team Insights, select Teams or Reports in the Tempo sidebar, then click the Team Insights tab in the upper right of the page. A right-side drawer opens to display a visual of the team's progress for the week, namely highlighting logged hours against expected weekly work hours and comparing current performance with historical trends, which can be used to identify underutilization or overutilization patterns.
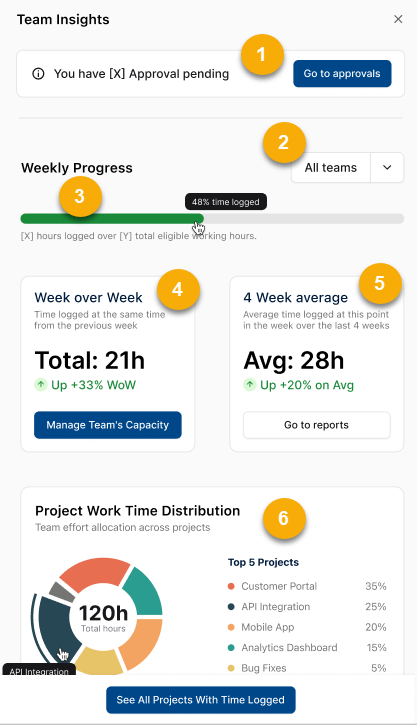
The Team Insights drawer displays the following key information:
-
Pending Approval Summary: Displays any pending approvals for team leads with Approve Timesheets permission. This section is hidden if there are no approvals pending or if you do not have Approve Timesheets permission.
-
Team Filter: Allows team leads to filter the weekly progress and Space Work Time Distribution metrics by the specific team(s) they manage. For Jira and Tempo admins, the default is All teams.
-
Weekly Progress Bar: Indicates the percentage of the team’s logged hours for the current week. The percentage is based on total logged hours from the beginning of the week to the current day.
-
Week over Week: Compares time logged for the current week against time logged for the same period the previous week. Click Manage Team’s Capacity to easily access Capacity Planner and adjust team allotments. If you do not have Capacity Planner installed, this button will take you to the Capacity Planner page in the Atlassian Marketplace.
-
4-Week average: Indicates the average time logged for the current point in the week based on the past four weeks. Also displays the percentage that the team is above or below the 4-week average. Note that newly created teams must complete their first full week of logging before trend analysis becomes available.
-
Space Work Time Distribution Module: This section displays a donut chart that visualizes how team time is distributed across spaces. The chart shows logged time across the top five spaces, and aggregates all remaining spaces into an "Other" category. You can hover over the chart to highlight the corresponding space in the chart and the legend.