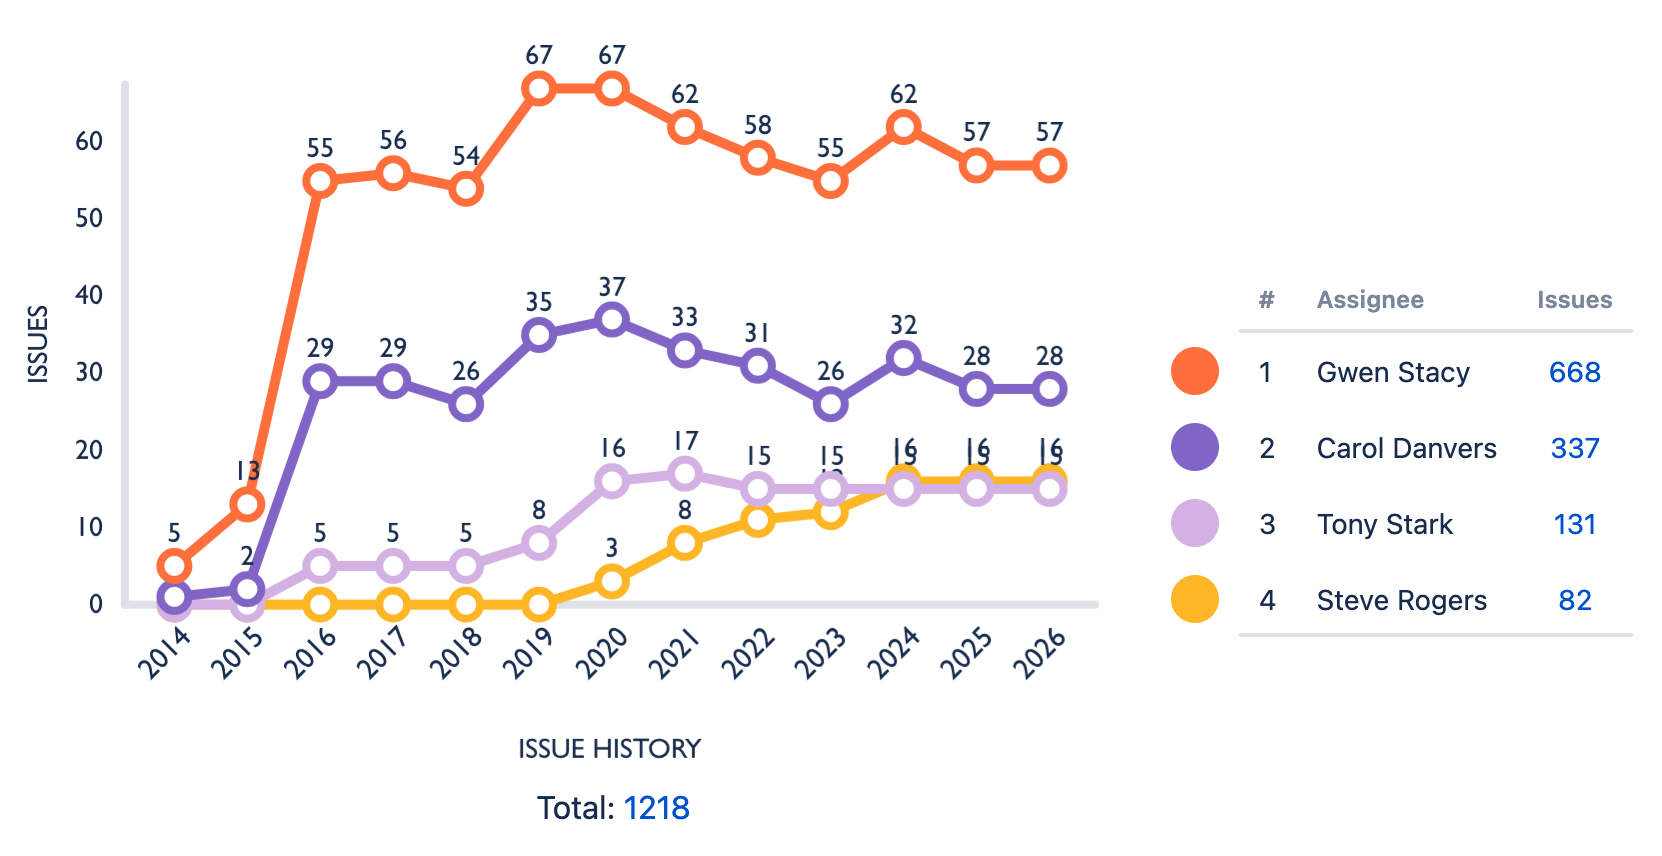
Use Custom Charts to view the history of work items over time, based on a selection of default fields.
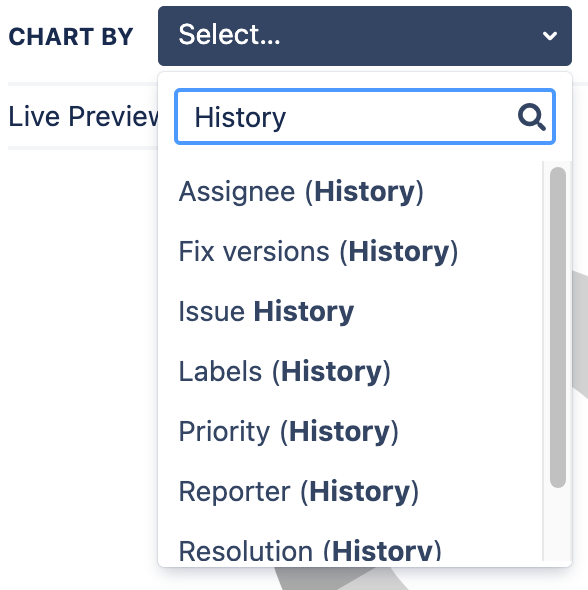
To set up a work item history chart, create a new chart, or edit an existing chart, and enter history in the search field. This displays the following options:
-
Issue History
-
Several Jira fields followed by (history).
Select a specific field’s history to populate your chart with chart segments based on a date range and group segments based on the selected field.
If you select Issue History, you need to select a Group by field before your data displays in the chart.
To do so:
-
Go to the Chart By tab
-
To change the date groups: select an option from the Grouping dropdown.
-
To change the date range: select an option from the Range dropdown.
If your chart is not two-dimensional, selecting a history field will convert the chart to a two-dimensional line chart. You can change the chart type later.
Adjusting the chart’s values
After you create a work item history chart, the data includes each time the work item had a matching value during the date range.
You can select Calculate final values in time period only in the Chart By options to only include the value of a work item at the end of the reporting period.
We recommend turning this setting on if you’re creating a burn down or burn up chart.
For example:
-
You’re building a chart that view the history of the status field across days.
-
A work item moves through To Do, In Progress, and Done in one day.
-
The data for that day will show that work item three times; one for each status it moved through.
-
With this option selected, the work item will be part of the Done status only.