After you create a chart and define your data sources, you need to decide how to display that data in your chart.
Chart segments
The available segments for your chart are based on the Chart By source. Two-dimensional charts have the same options available from the Group By menu.
If you want to rearrange segments, select an Ordering option or use the move handle to drag a segment to a new position.
Jira fields
Custom Charts adds a default set of segments based on the field you select as your Chart by or Group by values. For example, if you select Status as the initial value, the chart may include Open, In Progress, and Closed as segments. You cannot remove these default segments, but you can toggle their visibility by selecting the Eye icon.
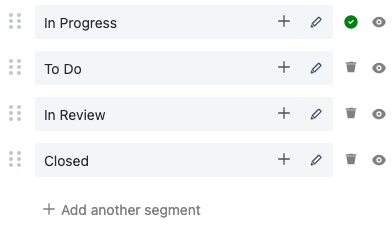
Select + Add another segment to insert more segments, or select + next to a segment to add another field to that segment. The available options are limited to fields related to the Chart By source. Select the Trash icon to remove segments you add this way.
Custom JQL
Selecting this as your source lets you use custom JQL queries as the value for your segments.
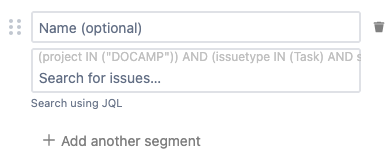
Select + Add another segment add a segment, then enter your query and press Enter to search for issues. You can give your query an optional name to improve your charts readability and you can select the Trash icon to remove a segment.
Saved filters
Selecting this as your source lets you insert saved filters as the value for your segments.
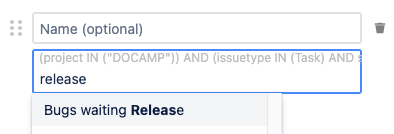
Select + Add another segment to add a new segment, then enter your search query and select a filter from the list. You can give your query an optional name to improve your charts readability and you can select the Trash icon to remove a segment.
Dates
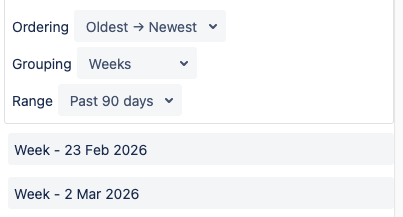
Date segments are only available for two-dimensional charts. Selecting this source creates segments based on the chart’s Range, and groups them based on the chart’s Grouping. You cannot edit, rename, or delete these segments.
Display options
Most of the available display options are available for all chart types. However, some charts have specific display options. Make sure you review the options available for your chart after setting up its segments.
Go to our Display Options article for chart-specific options and more details.
Dark mode
Select the Moon icon to enable dark mode for your chart.