Build a chart that shows work items and the length of time they’ve spent in different statuses.
Creating the chart
-
Create a new chart or edit an existing one.
-
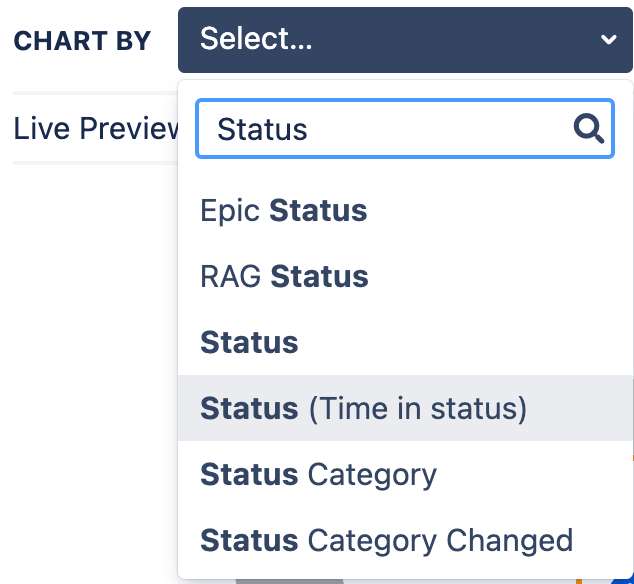
Go to Chart by and enter status in the search field.
-
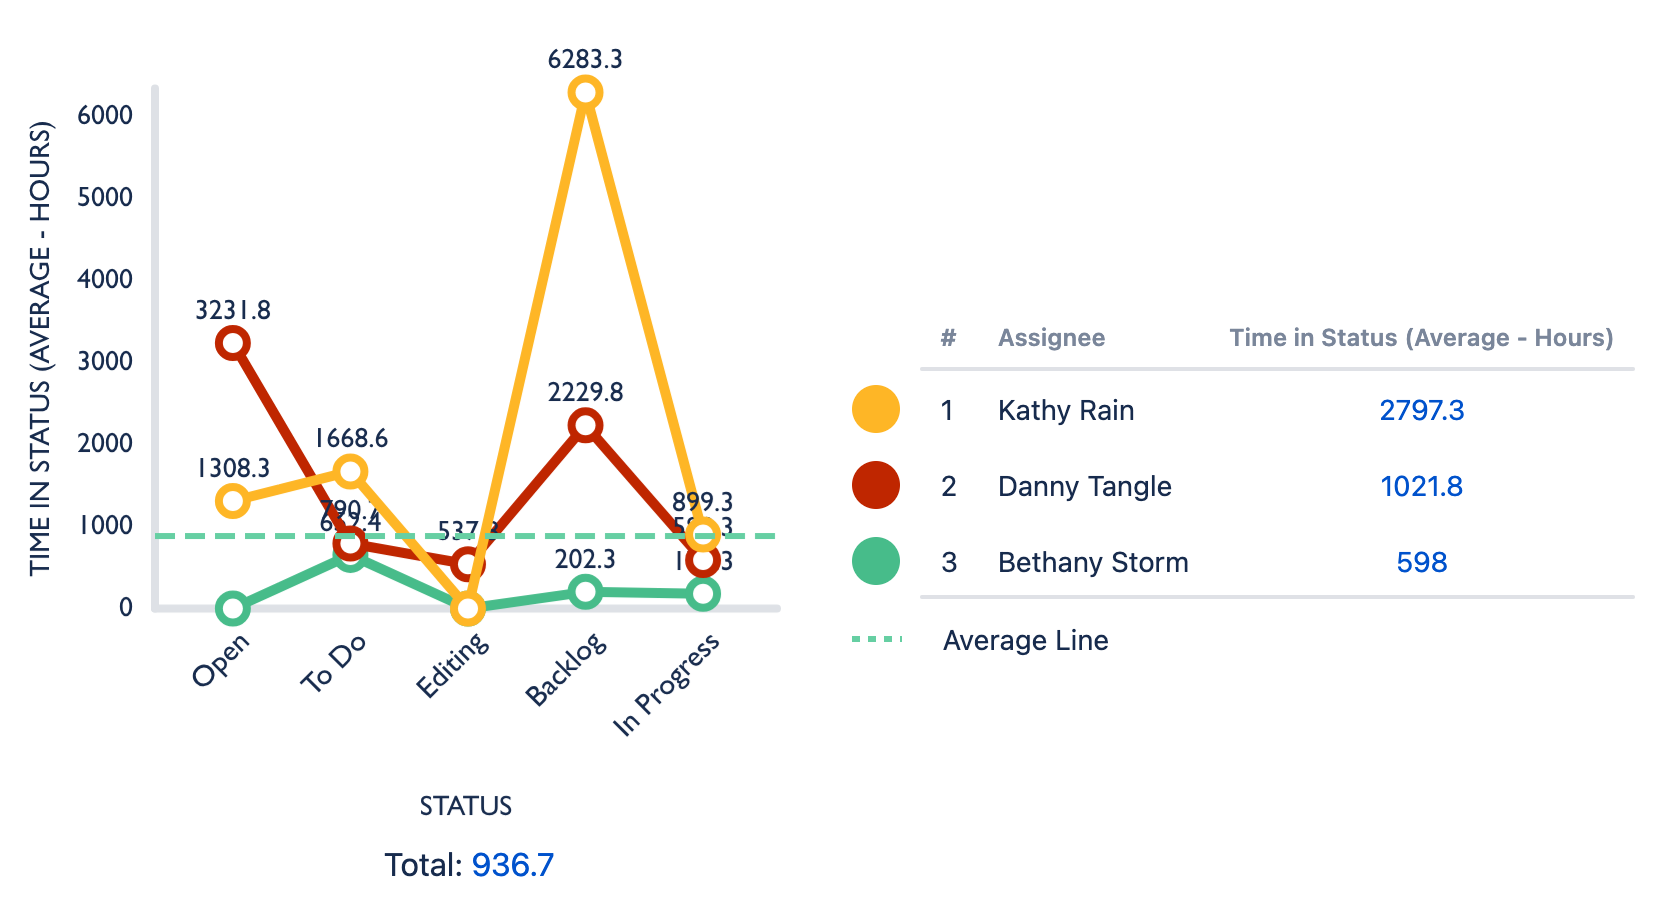
Select Status (Time in Status).
The chart displays the average time, in hours, that work items have spent in each status. You can change this to display the cumulative amount of time by selecting Sum from the Calculations list.
Changing the unit of time
By default, Time in Status displays its time data in hours. Go to the Display options tab and select a new unit of time from the Time Unit dropdown list.