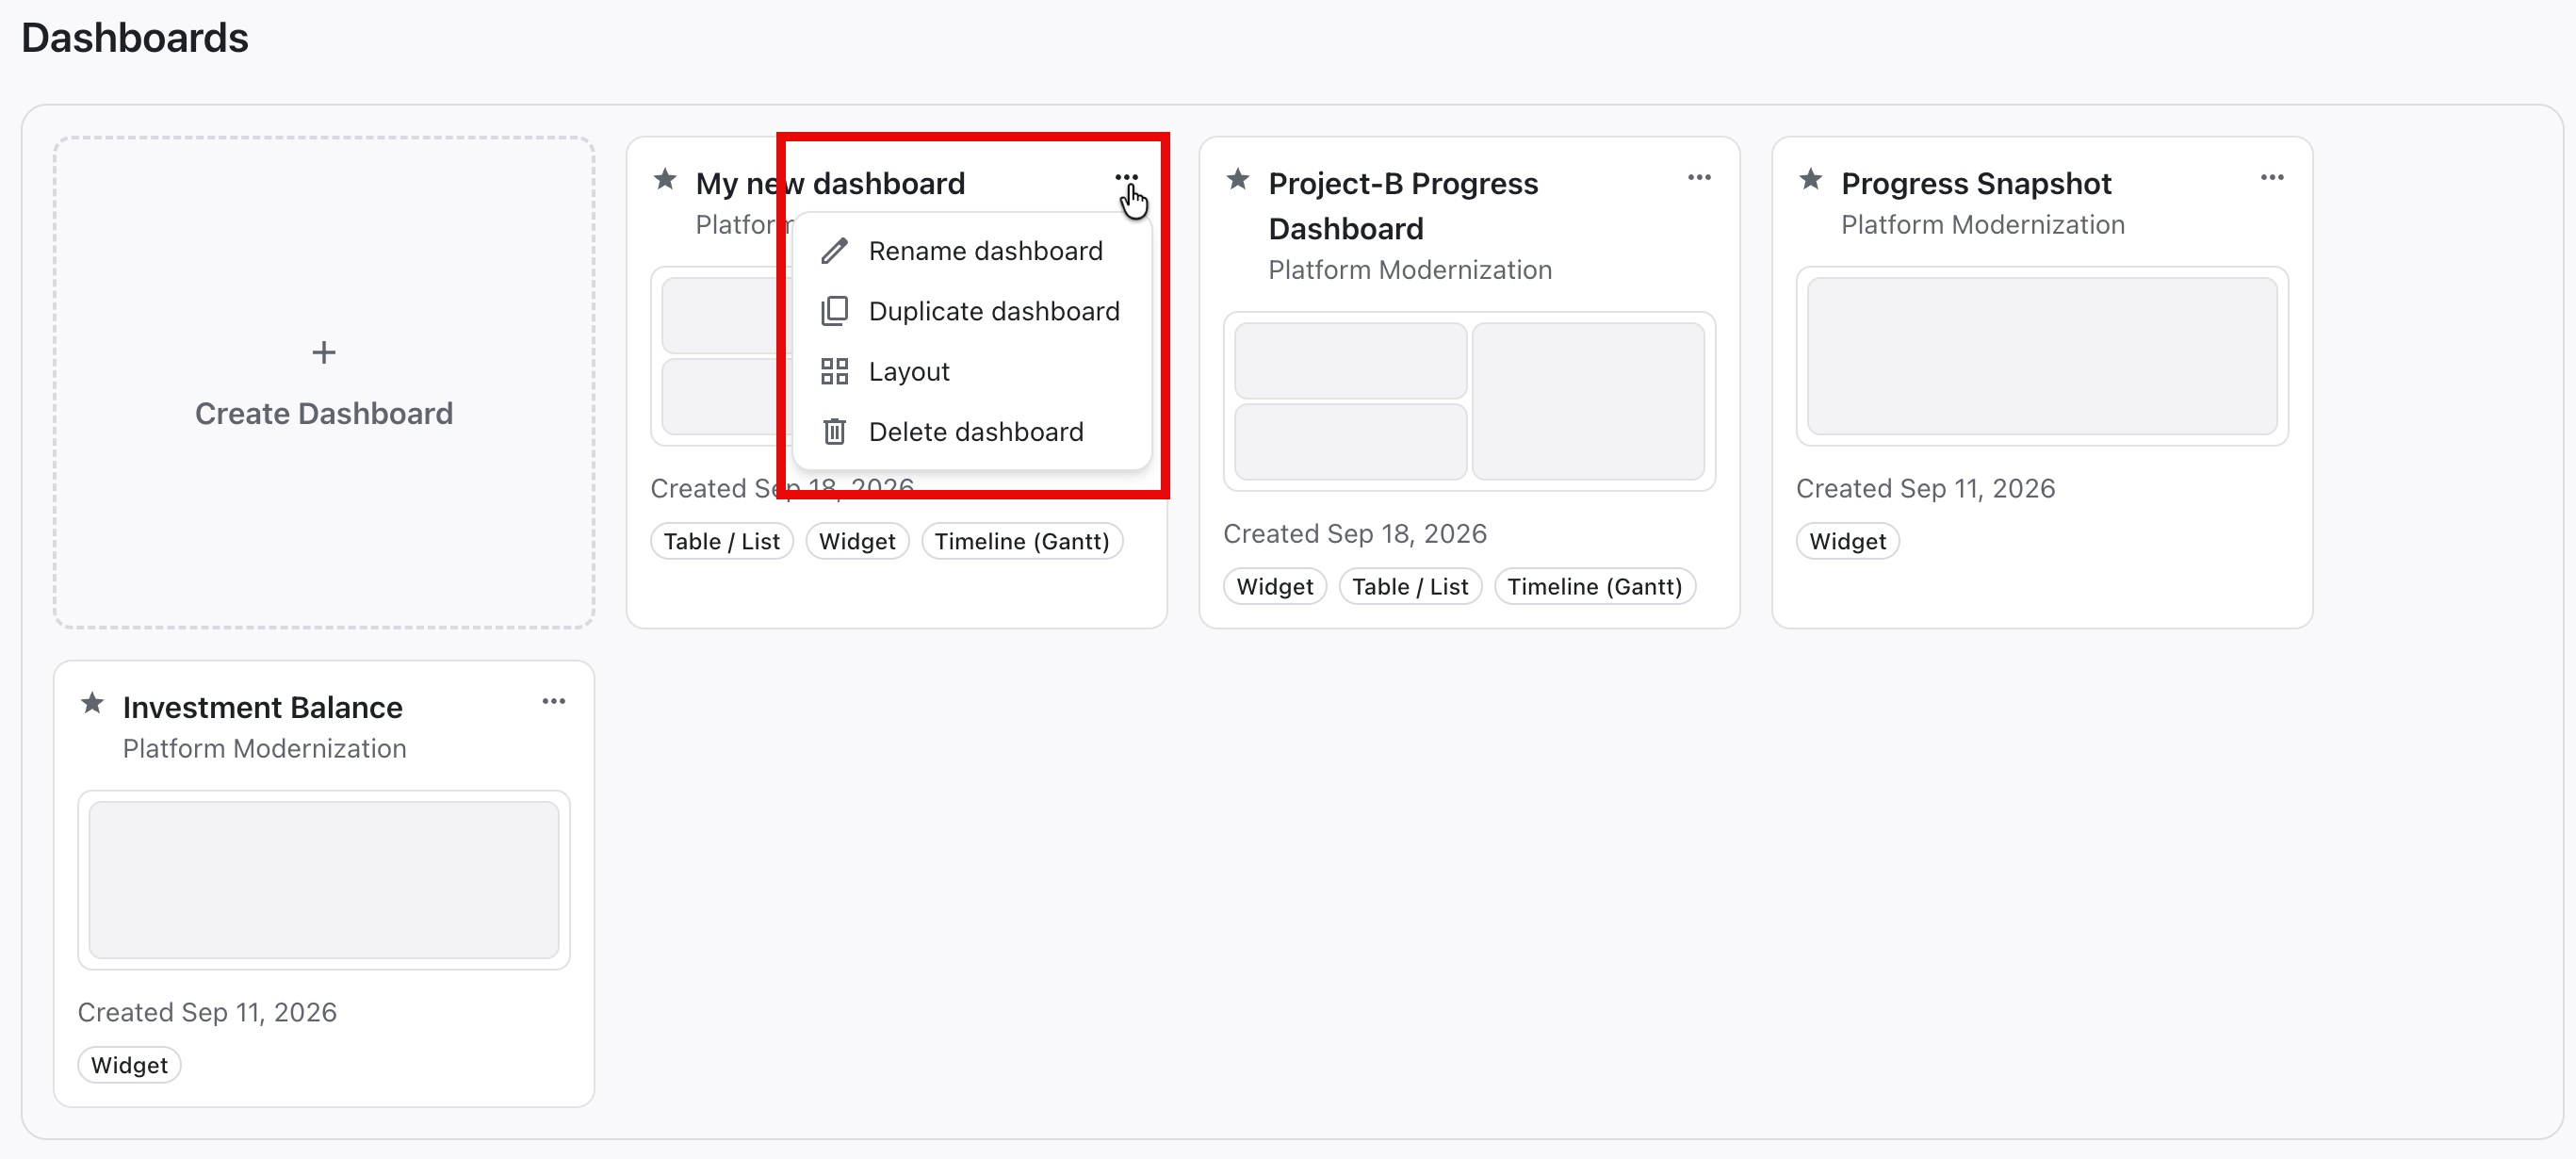
Dashboards allow you to create live, customizable visualizations to report real-time data to your stakeholders.
Viewing Dashboards
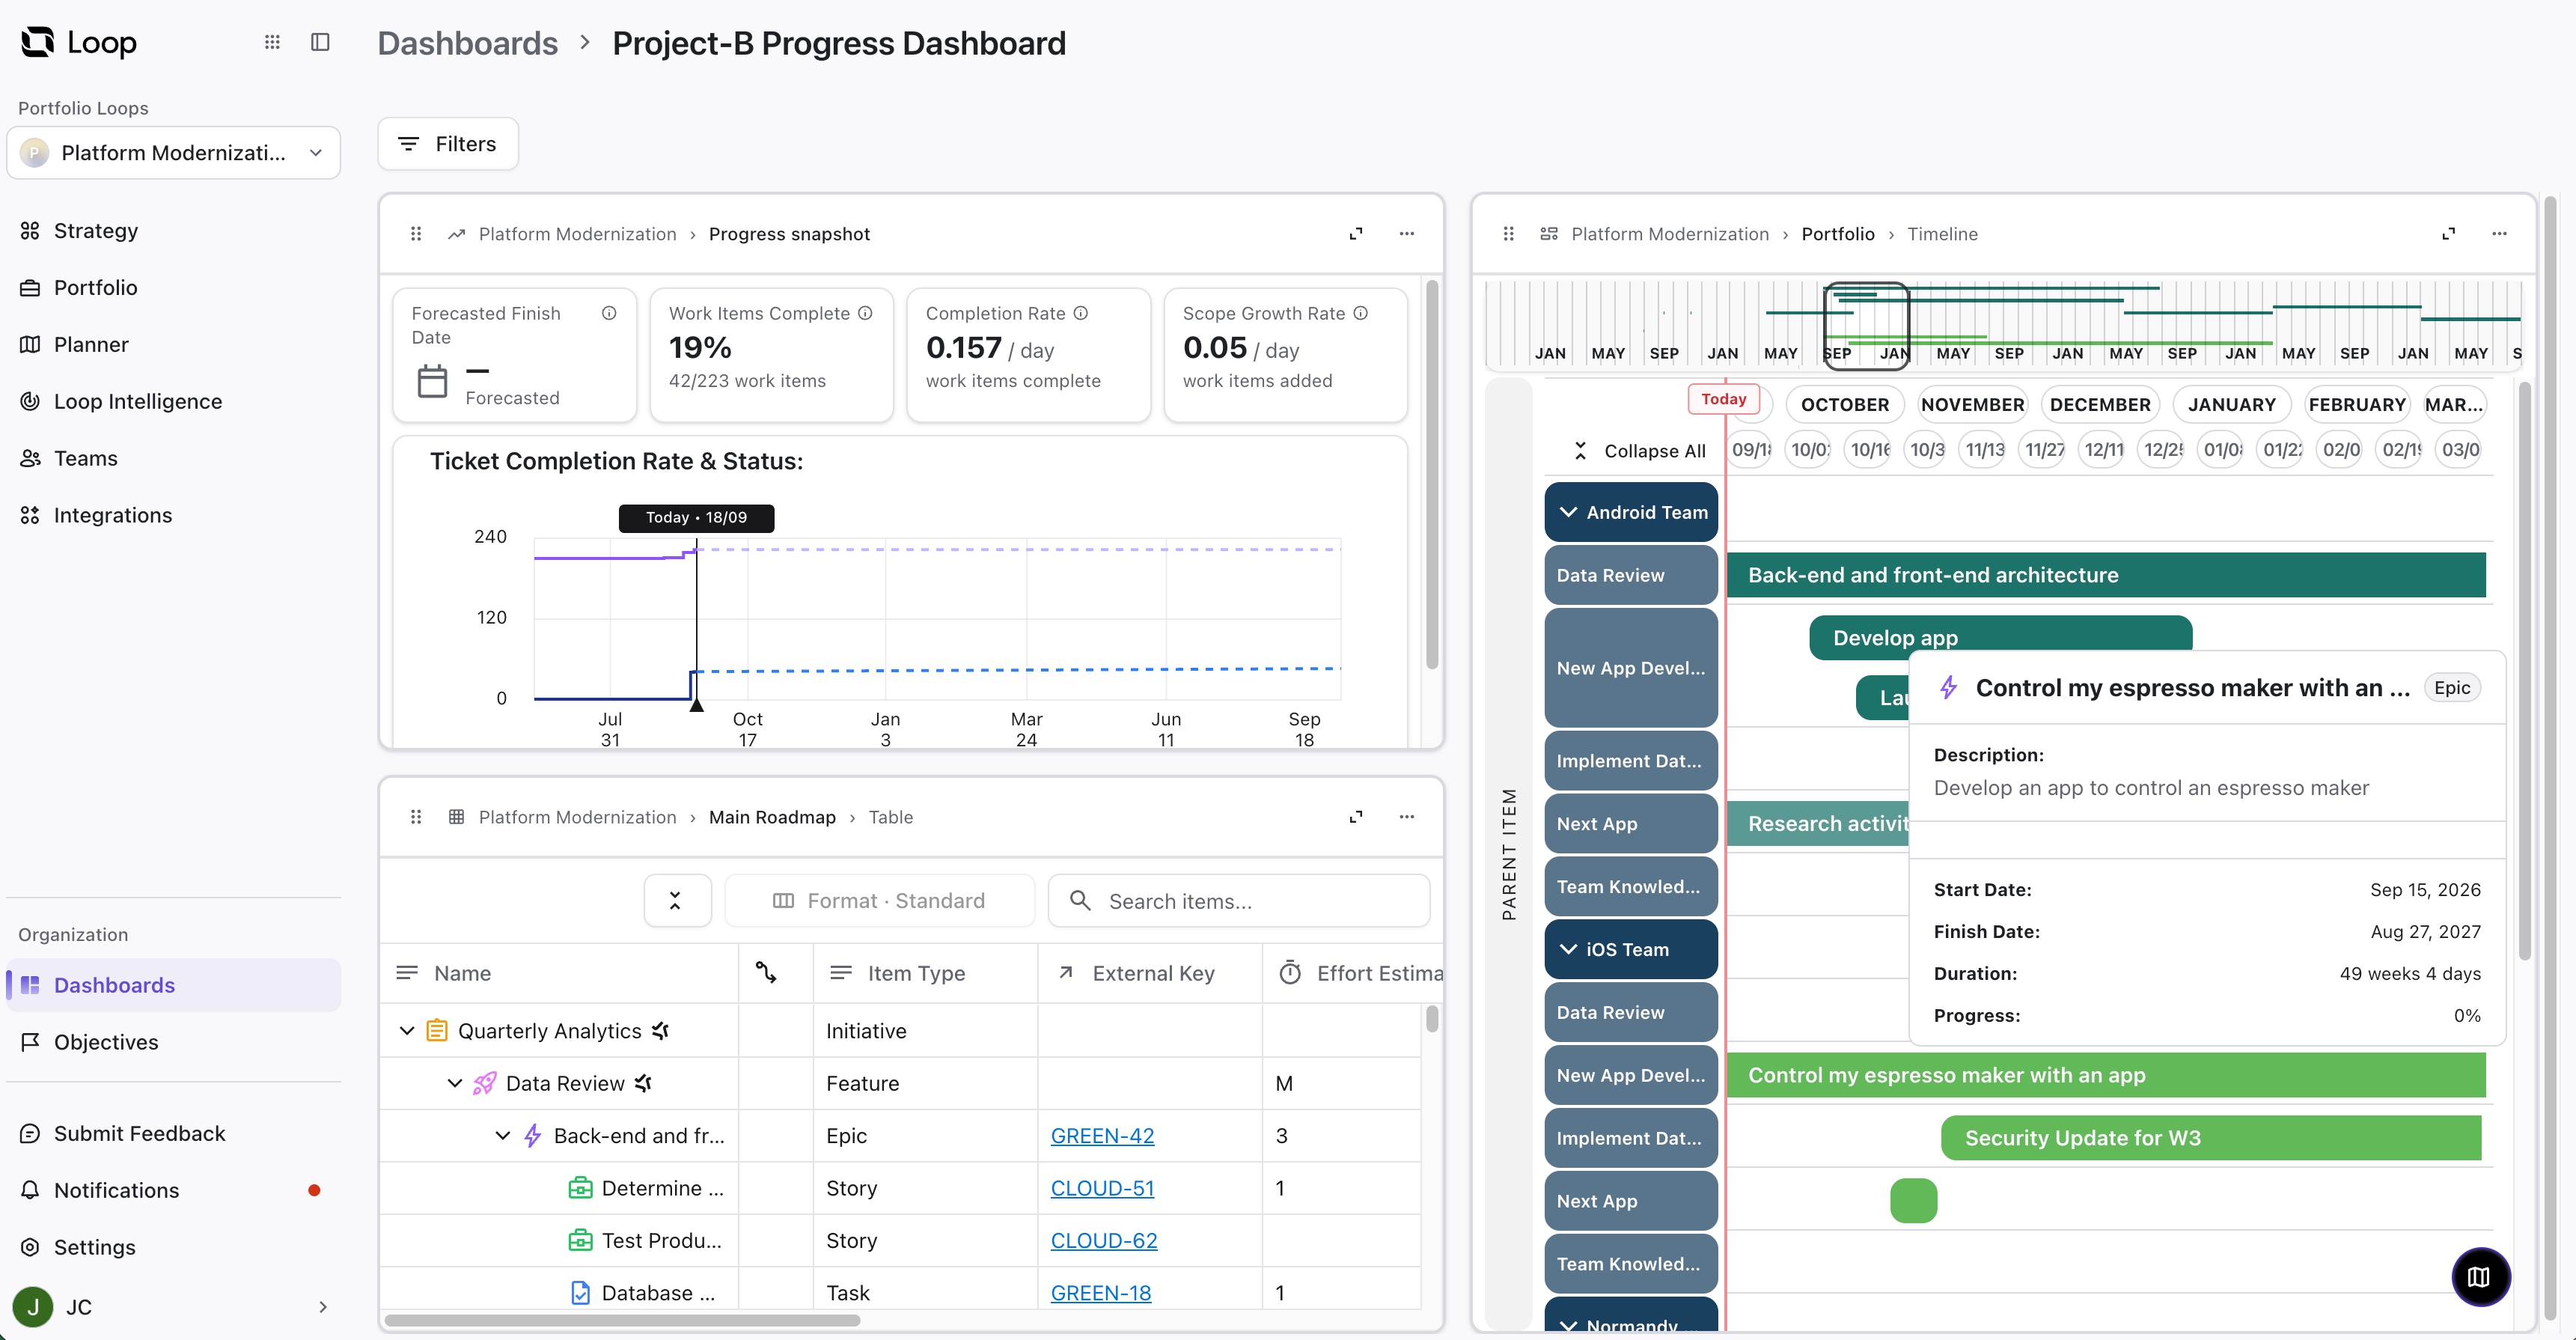
To view a dashboard, open the Dashboards screen from the left navigation and select the desired dashboard.
Creating Dashboards
To create a new dashboard:
-
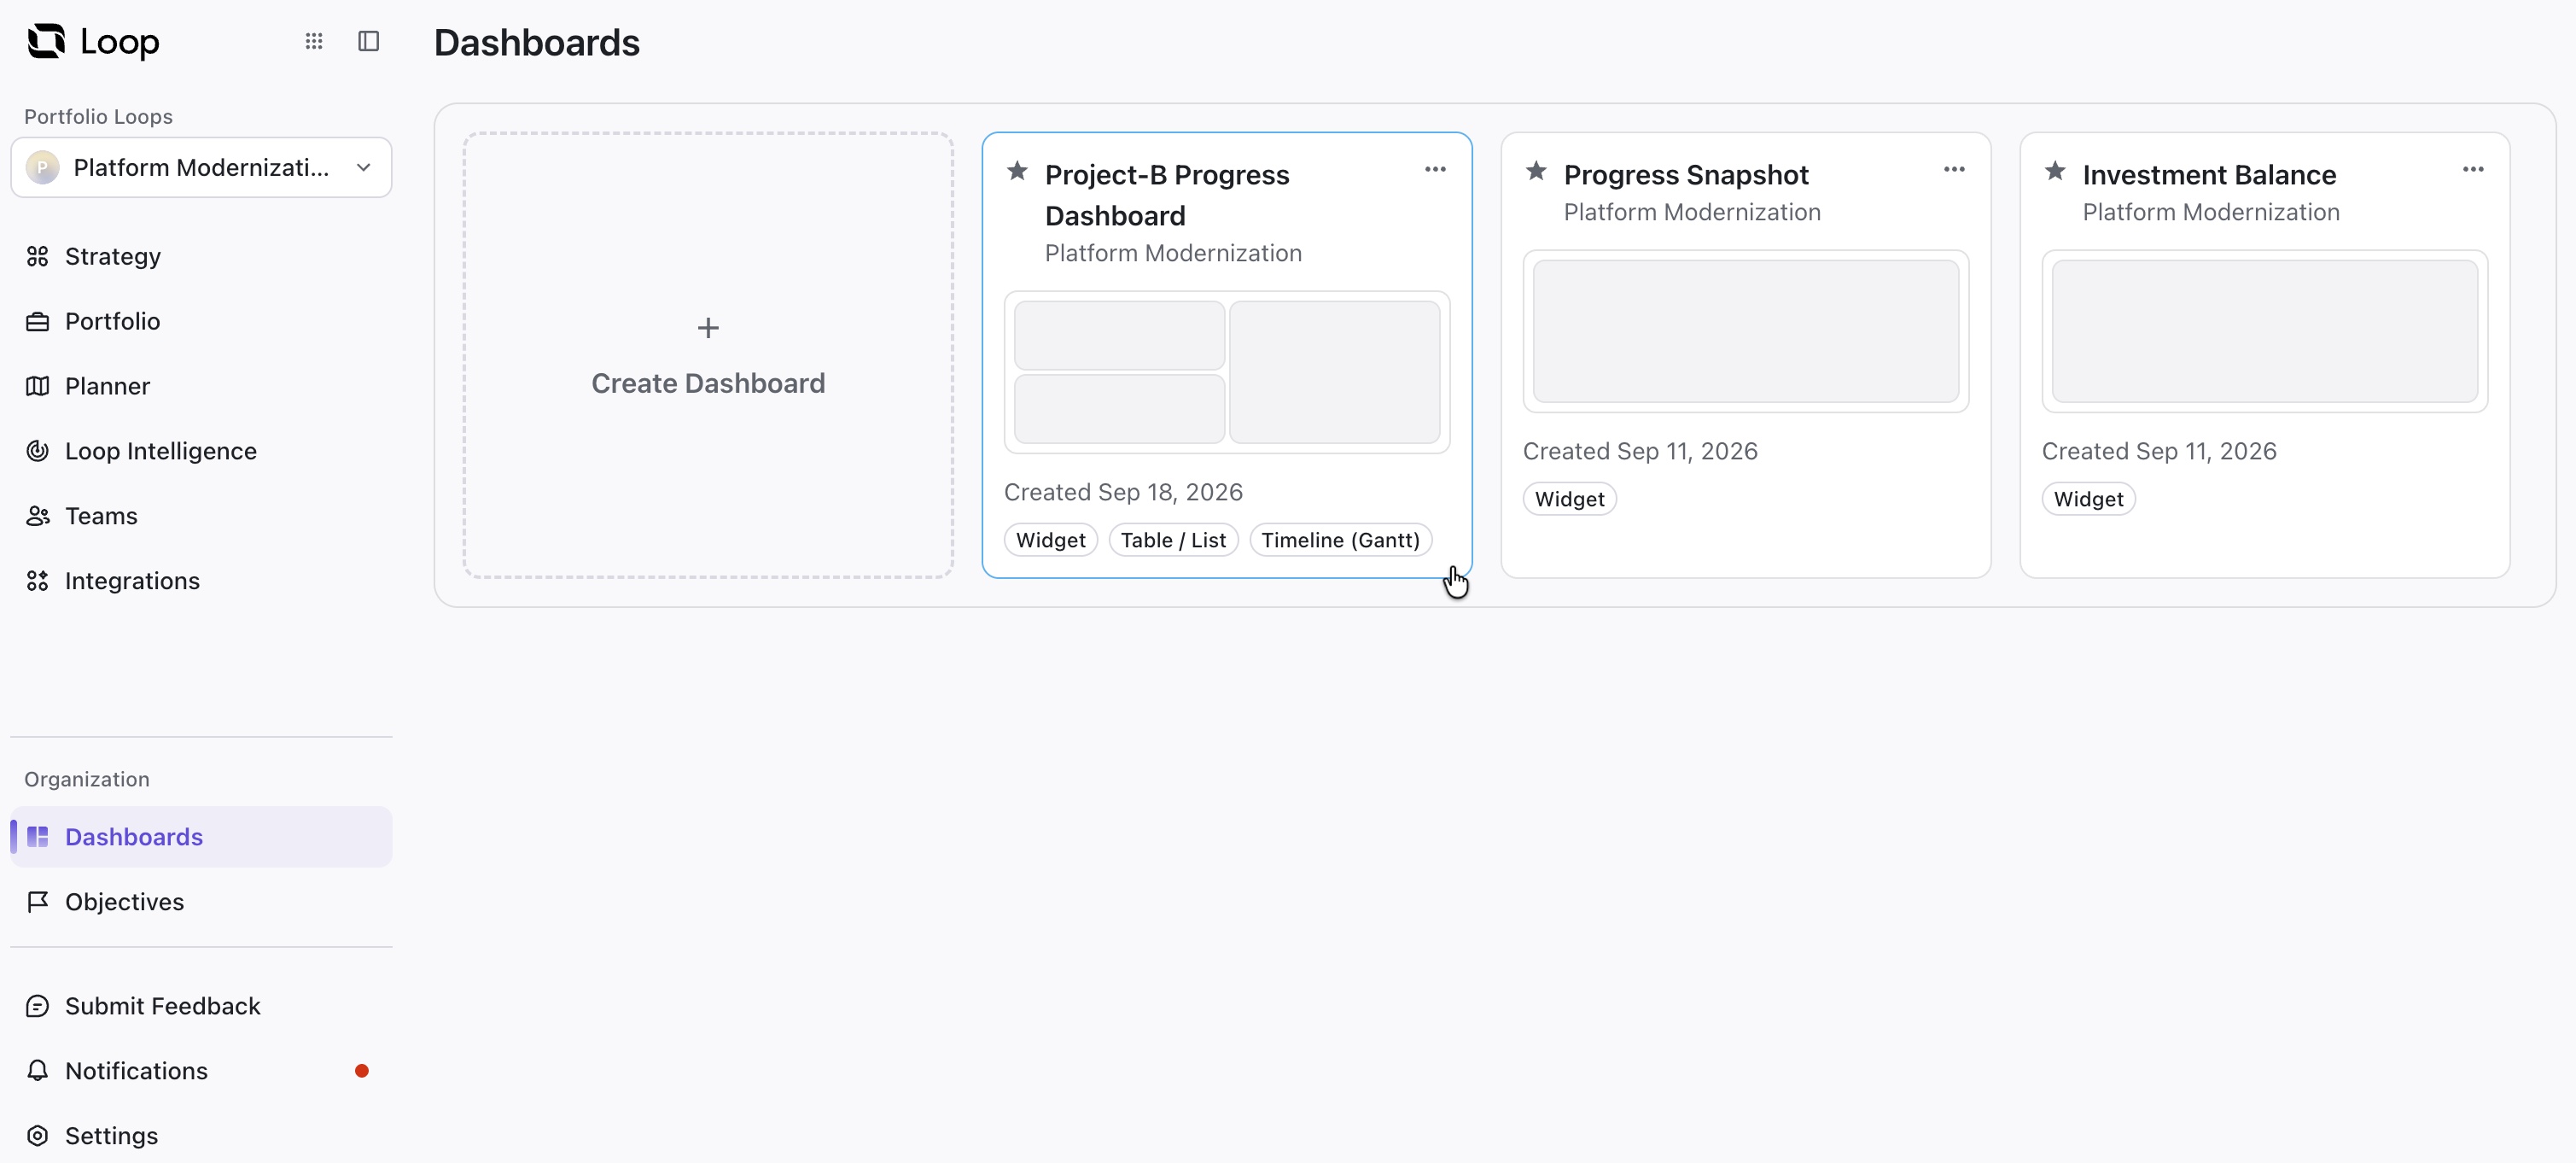
Go to Loop | Dashboards and select Create Dashboard.
-
Select the dashboard layout - there are several layout options, depending on how many visualizations you need to display.
-
Select the components - you can choose from existing Portfolio visualizations or a selection of Loop gadgets.
-
Name your dashboard and click Create Dashboard.
Editing Dashboards
Configuring Dashboard Components
Some visualizations and widgets can be configured to display specific data. For example, you can adjust the time window of a Progress Snapshot widget.
To configure a dashboard component, click the three dots and select Configure.
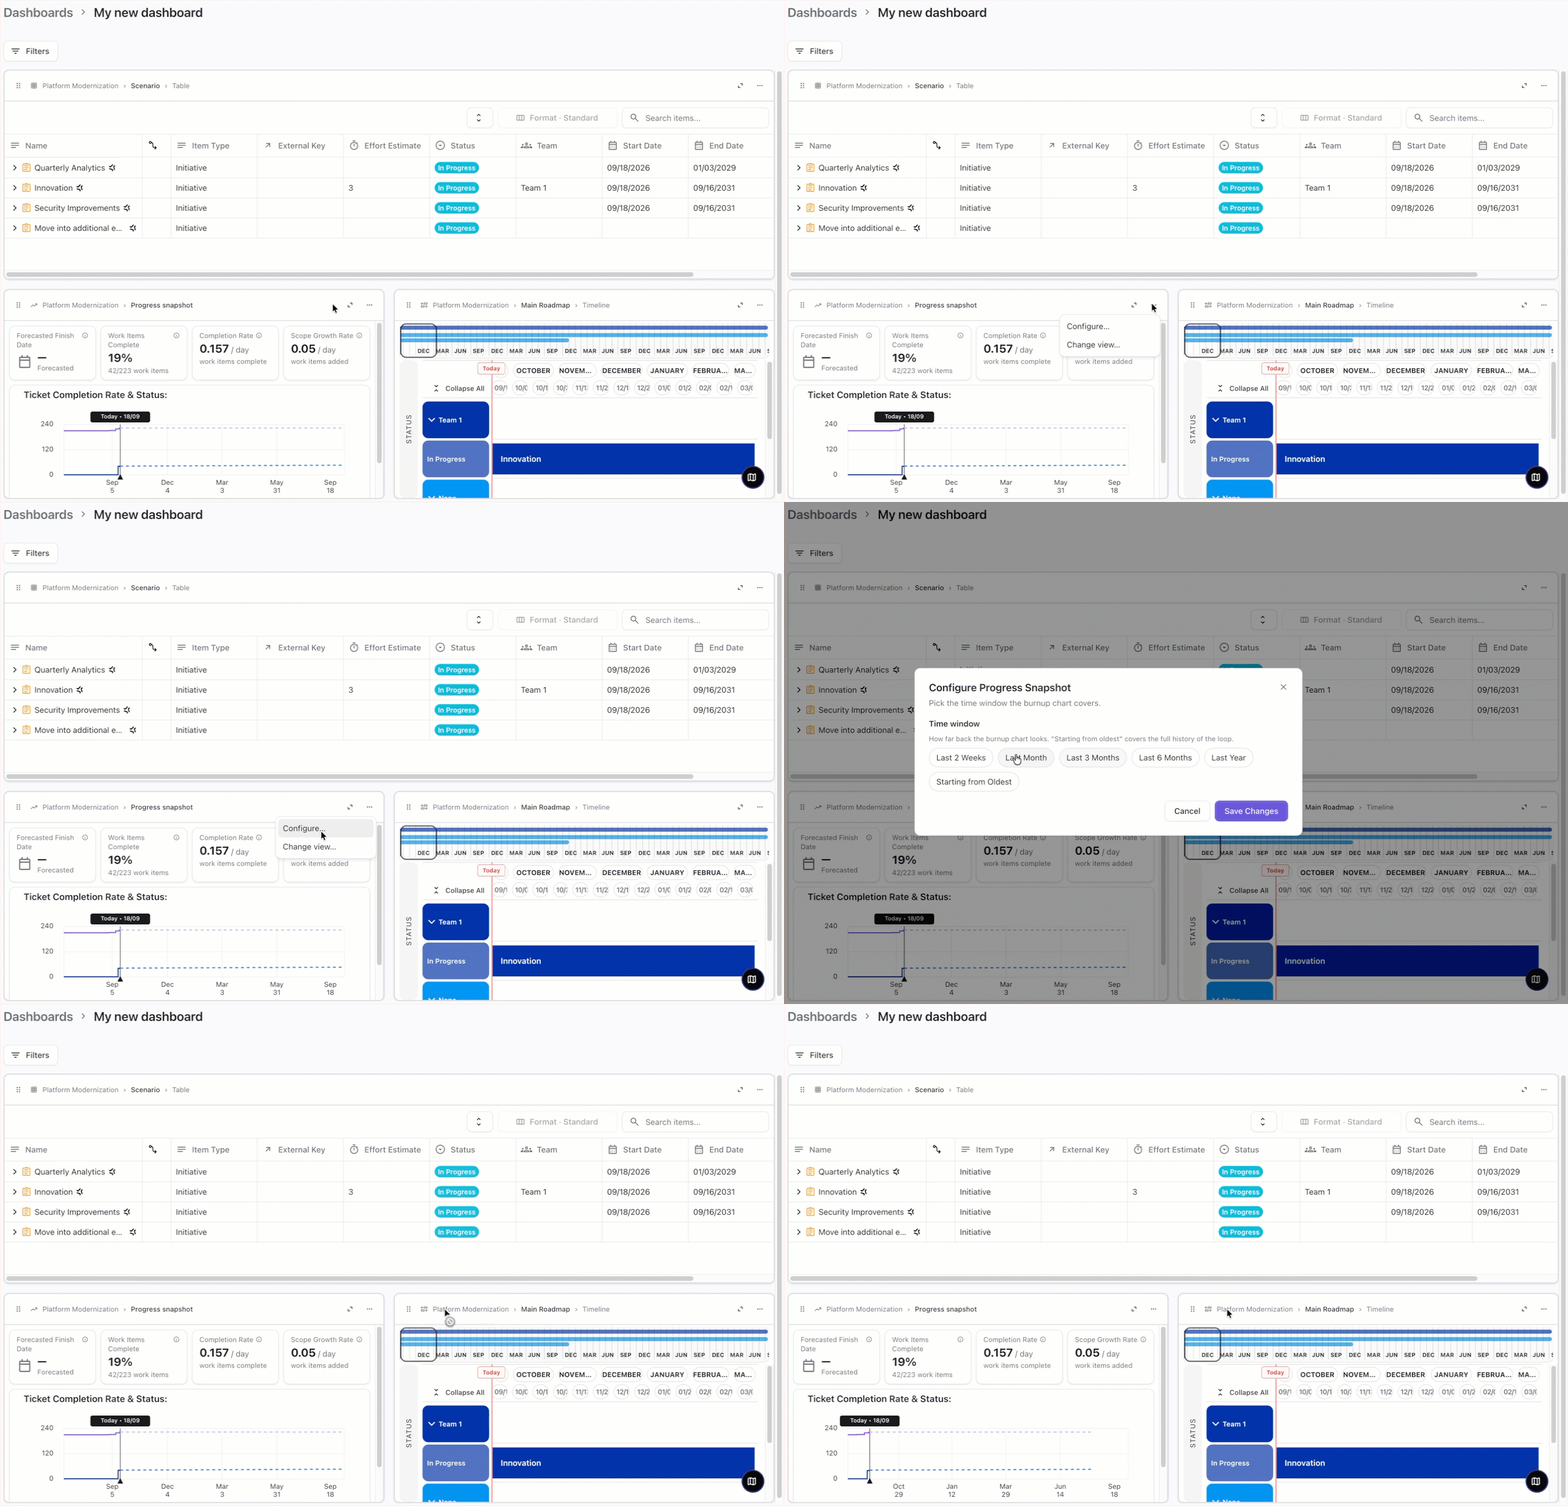
If there isn’t a Configure option, the visualization cannot be adjusted in the dashboard. To make adjustments, edit the source Portfolio visualization.
Rearranging a Dashboard
To change the arrangement of a dashboard, grab an item’s drag bar and move it to the desired location.
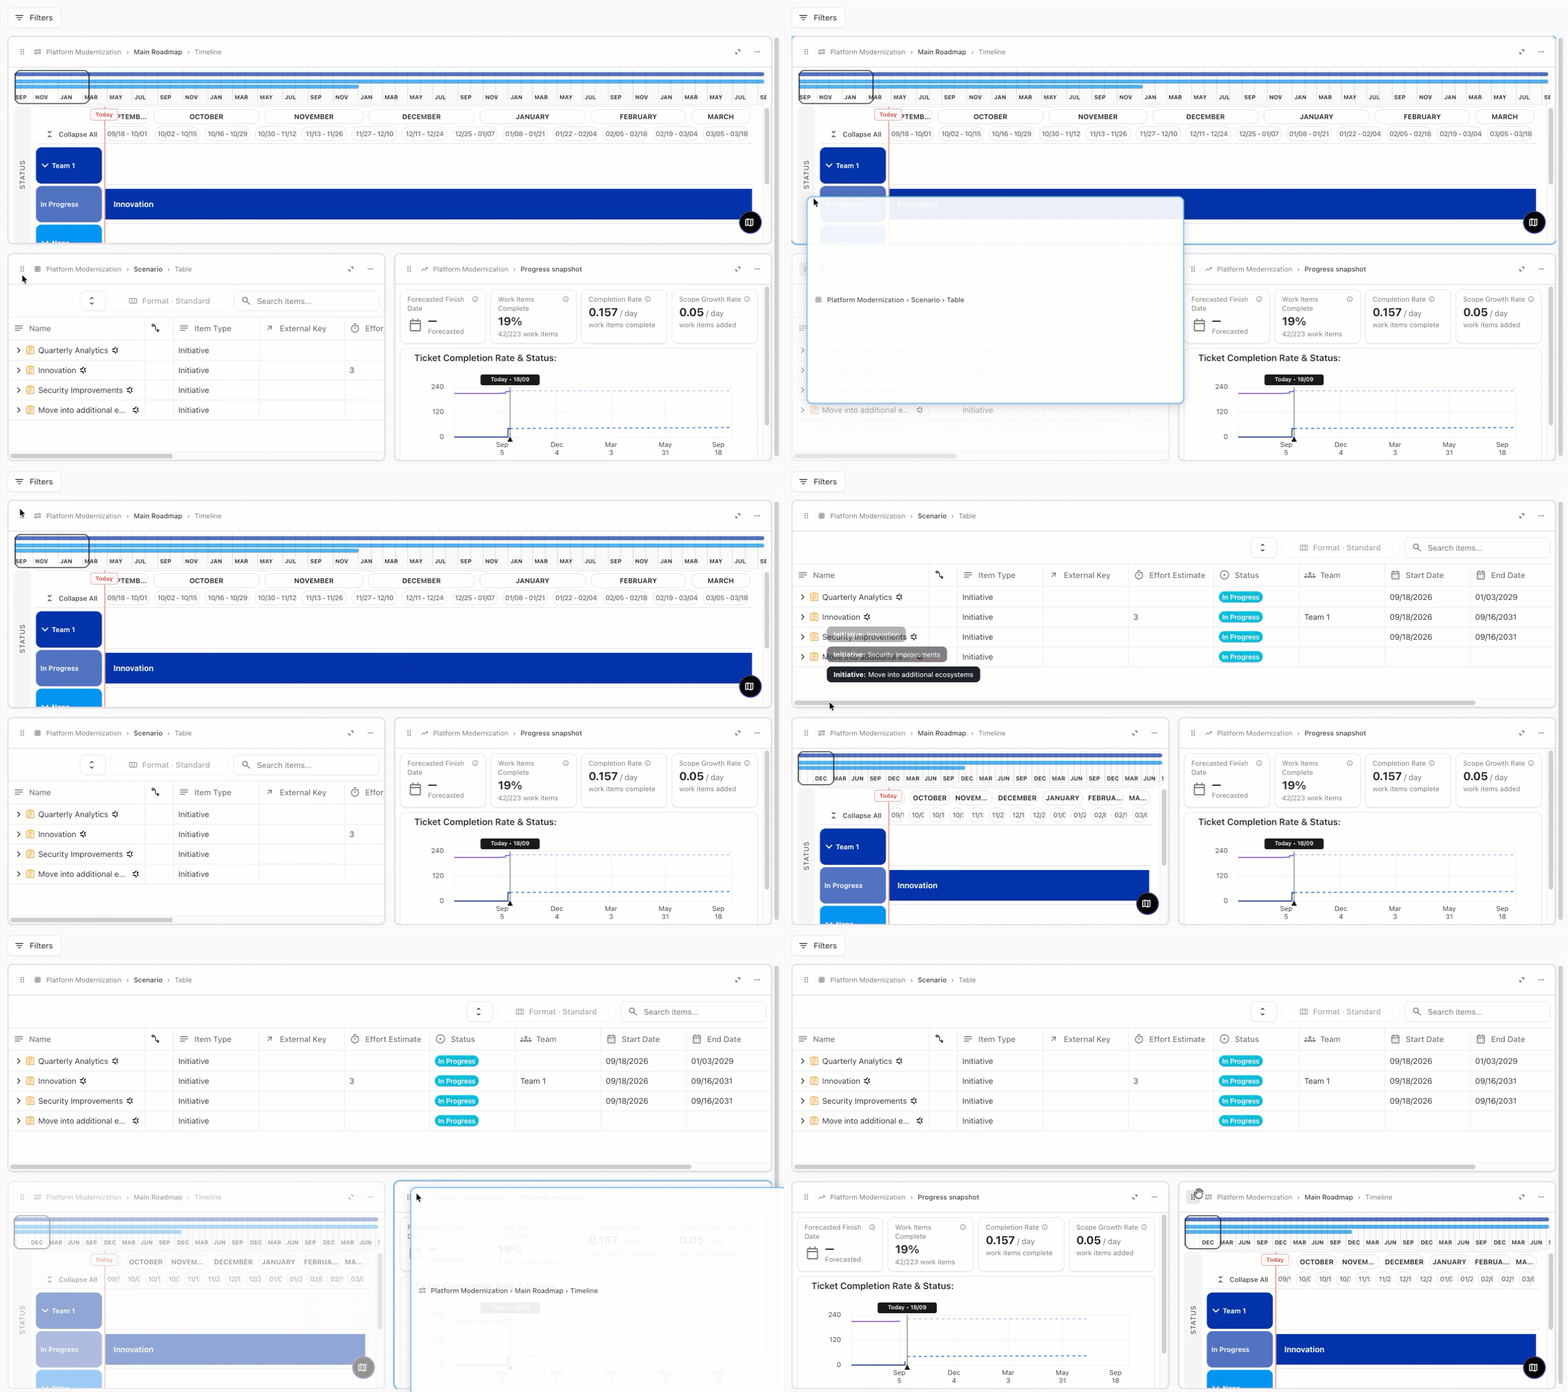
When you move items, the dashboard layout remains unchanged. When moving items from a small block to a larger one, each visualization automatically adjusts to the available space.
Changing Components
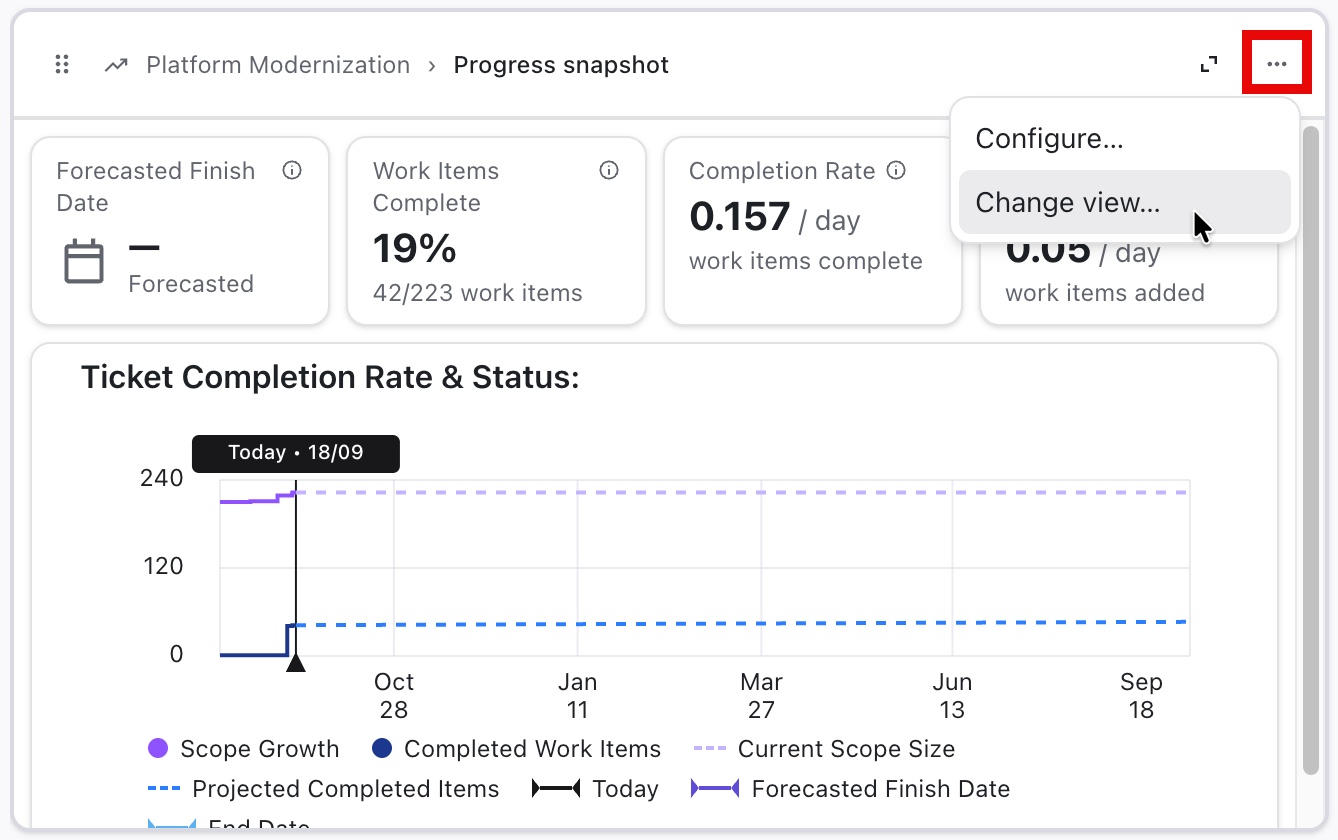
To replace an existing component with a different visualization, click the three dots and select Change view.
Expanding a Component
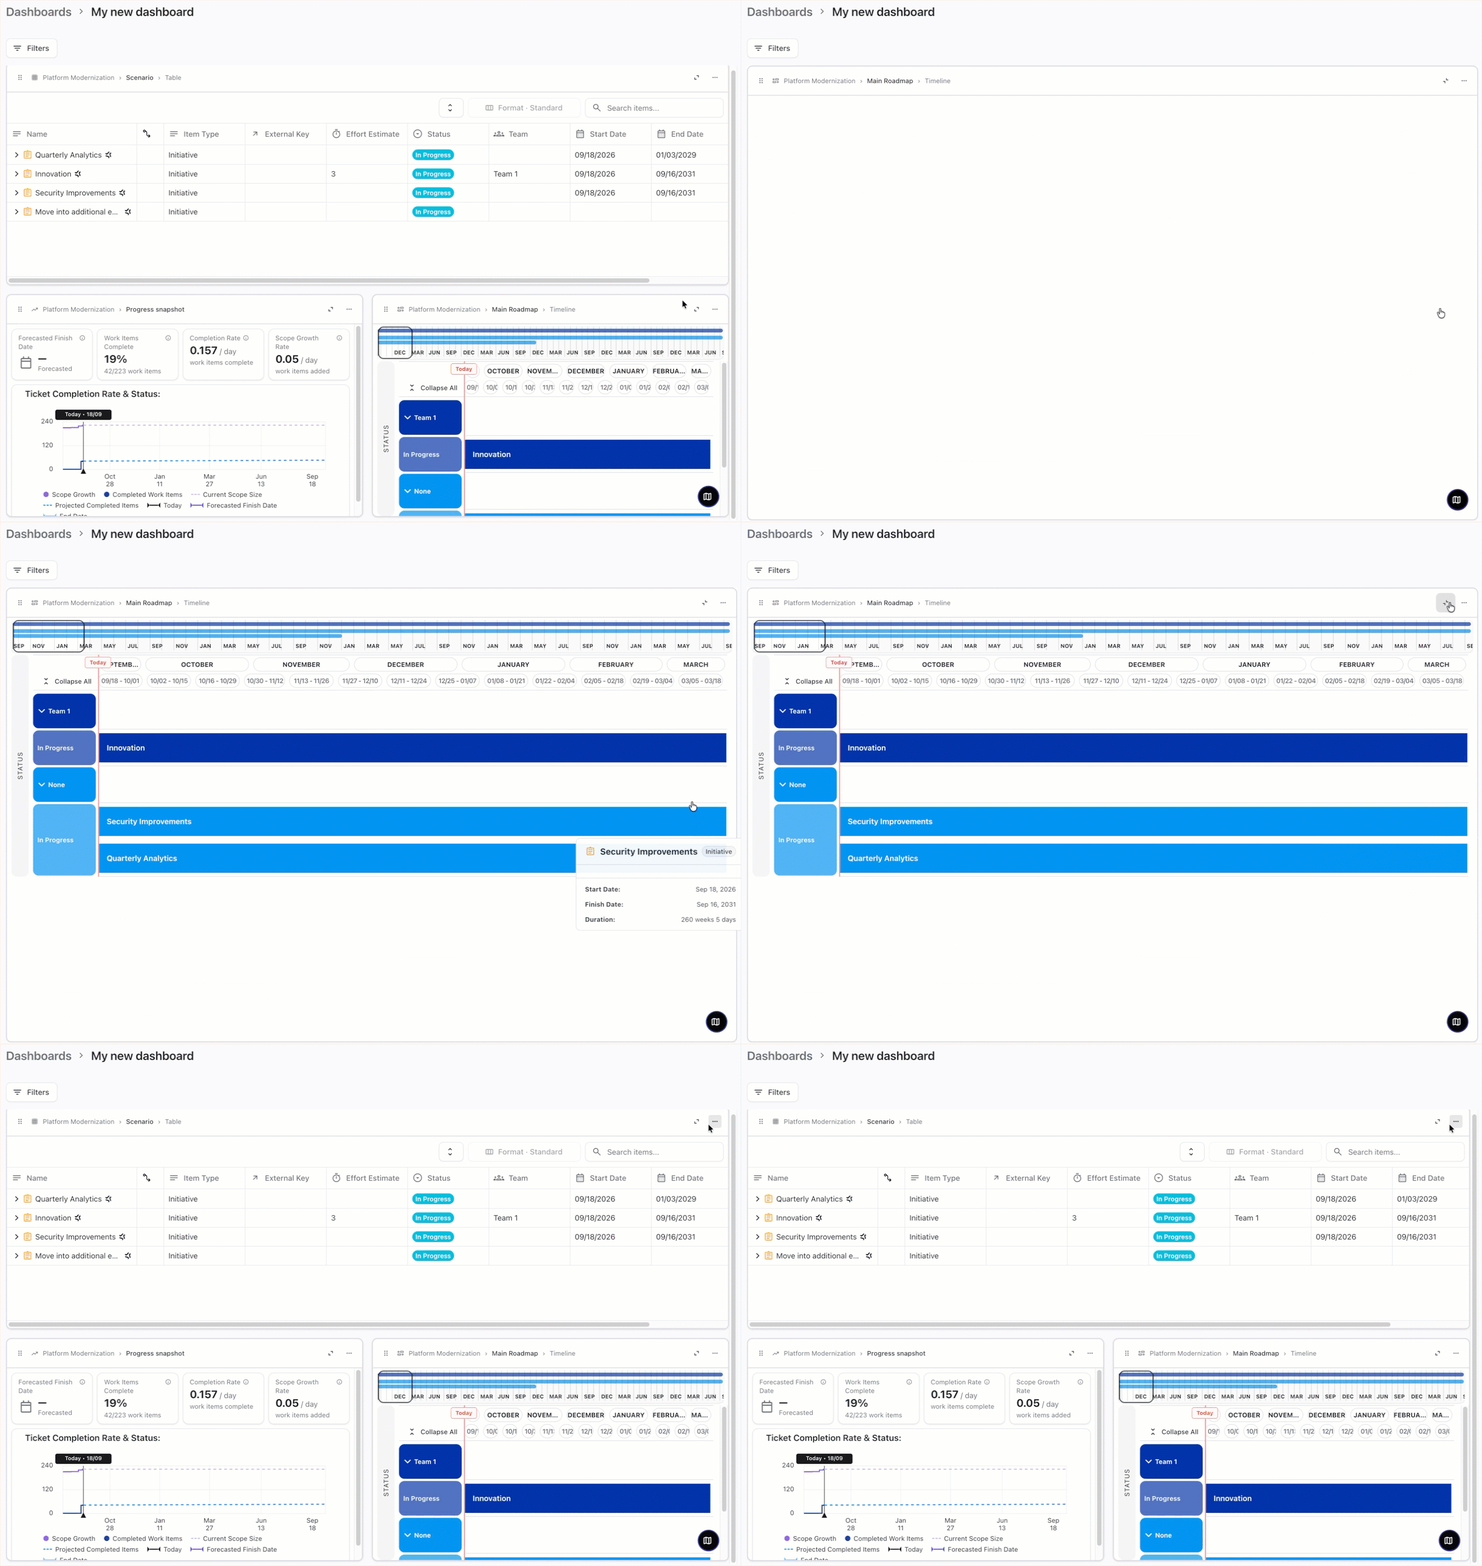
Click the Expand button to stretch a component to fill the entire dashboard window. Select the Collapse button to see all your dashboard components again.
Managing Dashboards
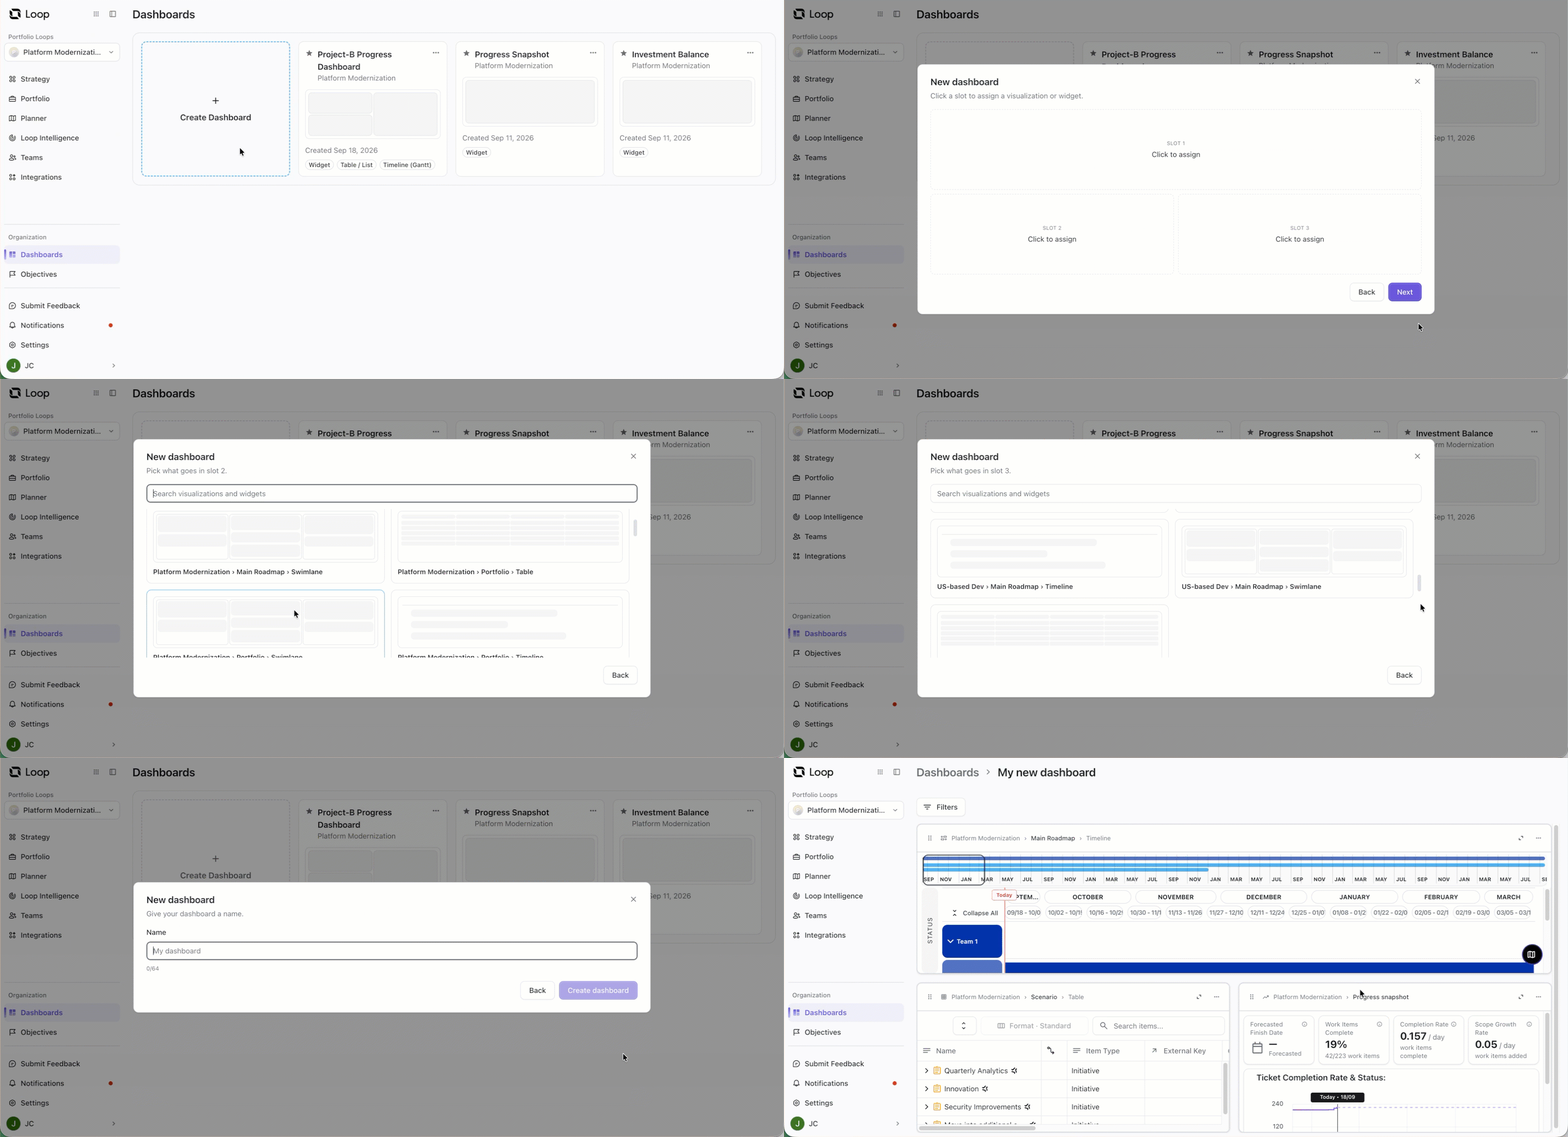
On the main Dashboard screen, select the three dots on a dashboard card to manage the dashboard. From this menu, you can:
-
Rename the dashboard
-
Duplicate the dashboard
-
Change the dashboard’s layout
-
Delete the dashboard