Now that you have a Simple Search on your dashboard, let’s add a Custom Chart to use that data.
Adding the Custom Chart gadget
To add this gadget to a Jira dashboard:
-
Open the dashboard and select Edit.
-
Select Add gadget.
-
Scroll to the gadget and select Add.
You can also enter the name of the gadget in the search field to find it.
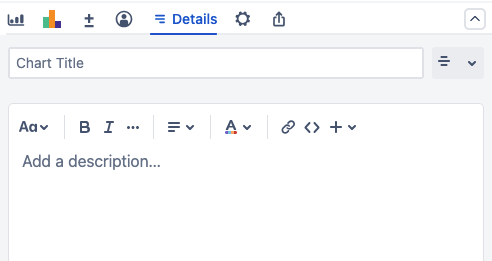
After you add a gadget, close the introductory pop-up window then go to the Details tab to give it a Title and an optional Description.
Select Don’t show this again to disable the pop-up window from displaying for future gadgets.
Setting up the Custom Chart
Notice that the source for your new chart is set to the Simple Search you created.

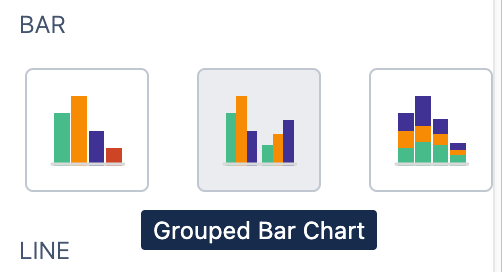
You can select from a variety of chart types when building a custom chart, but for this guide you will use a grouped bar chart.
After adding a custom chart:
-
Select Create New Chart.
-
Select Grouped Bar Chart.
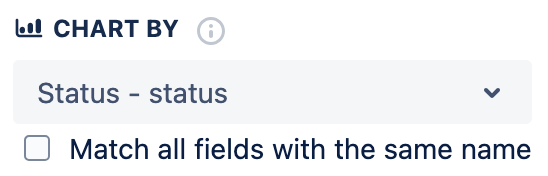
-
Select Status - status as the Chart By source.
-
Select Assignee as the Group By source.

-
Select Save Gadget.
Next steps
Continue with the next guide to add an Issue List to your dashboard.
After finishing this quick start, go to the Custom Chart user guide to explore more details about this gadget.