
Workforce Intelligence Initial Release
Workforce Intelligence is now available on the Atlassian Marketplace. This initial version (1.0) gives engineering leaders visibility into how AI tools are contributing to their team's work -- what they cost, where they are used, and whether they are accelerating delivery. Everything is detected automatically. Nothing changes about how your engineers work.
General Overview
-
Work Records
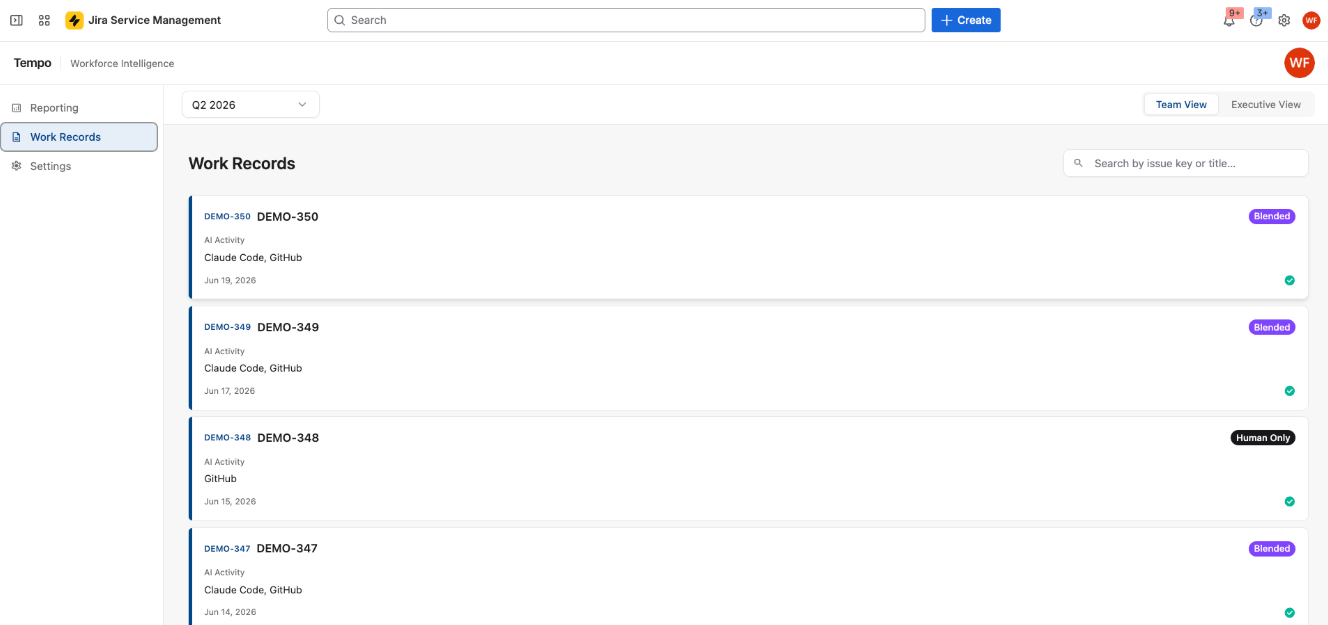
Work Records gives your team leads a single place to see all detected human and AI activity for any period.
-
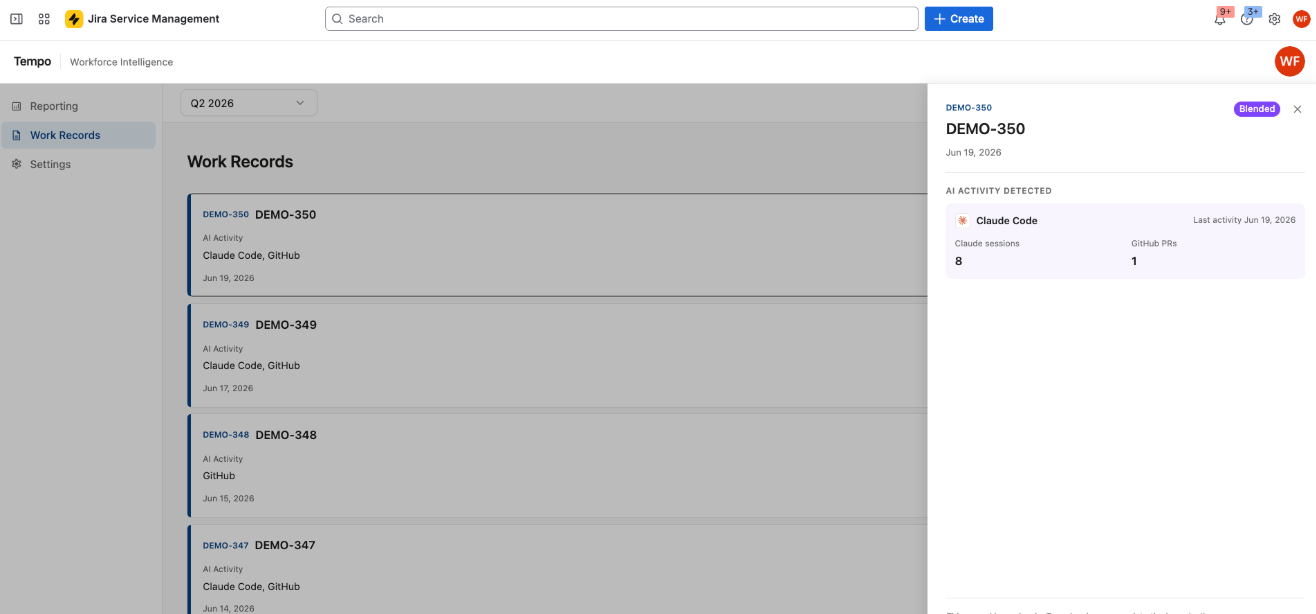
Read-only work record detail
Clicking any confirmed record opens a detailed view showing which tool was used, the number of sessions, and the number of PRs. The detail view is read-only.
-
Reporting
Reporting gives engineering leaders the data they need to answer questions about AI adoption, productivity, and cost without assembling it manually from multiple sources.
Team View
-
AI adoption and cycle time KPIs
Four headline cards give team leads an immediate read on the period: AI adoption rate with quarter-over-quarter trend, blended work item count, AI cycle time impact showing how much faster AI-assisted work is being completed compared to non-AI-assisted work, and agent-only work item count. -
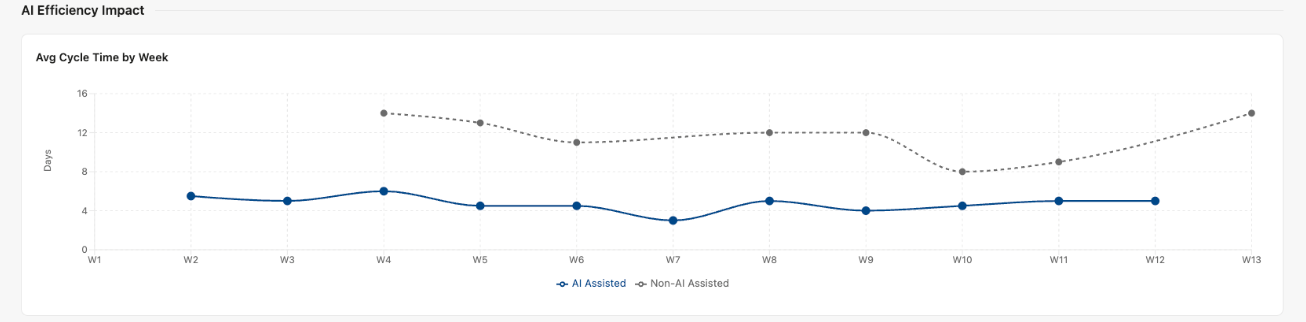
Cycle time trend chart
A 12-week trend chart shows average cycle time for AI-assisted and non-AI-assisted work side by side. The widening or narrowing gap between the two lines is the efficiency story for the period.
-
By Engineer table
The By Engineer table shows each engineer's AI adoption rate. -
Work items table
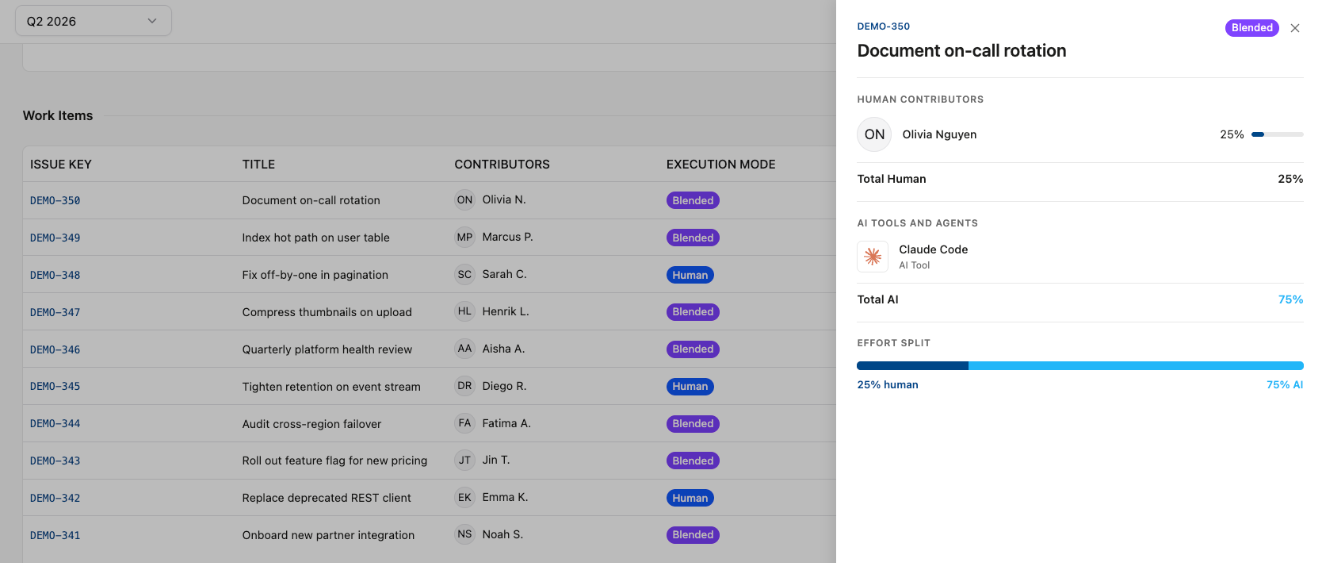
A full work items table at the bottom of the Team View shows every completed work item for the period with contributor count, execution mode, AI tools detected, and effort split. Clicking any issue key opens the work item drill-down. -
Work item drill-down
The work item drill-down opens as a slide-out from the work items table and shows the complete activity picture for a single Jira issue -- every human contributor with their effort contribution, every AI tool and agent detected with its activity summary, and the overall effort split between human and AI. The panel is read-only.
Executive View
-
AI investment KPIs
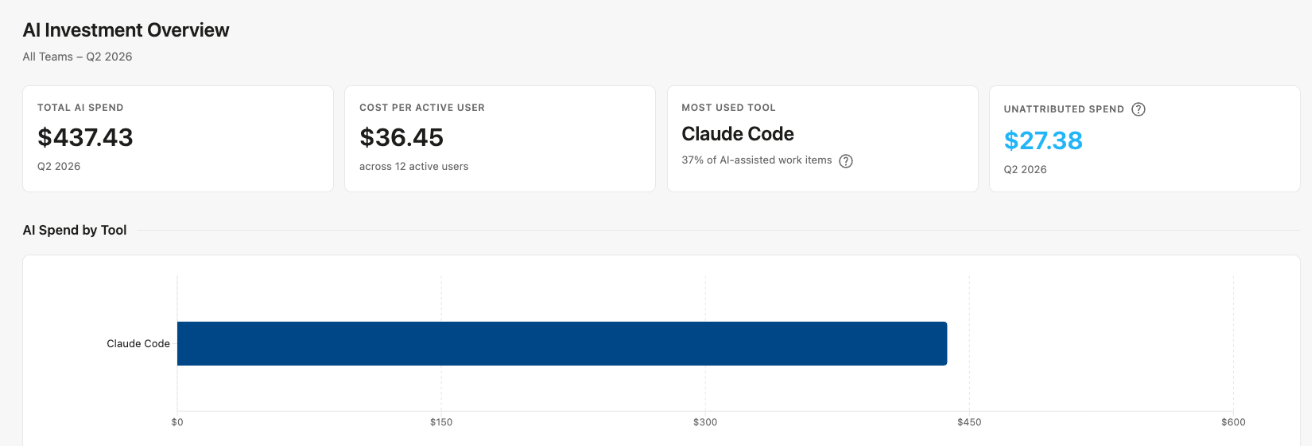
Four headline cards give CTOs and executives an immediate read on AI spend for the period: total AI spend, cost per active user, most used tool by share of AI-assisted work items, and unattributed spend. -
AI spend by tool
A bar chart shows total AI spend for the period, broken down by each connected tool and sorted by spend. This release covers Claude usage through the Anthropic Console connector and Claude Code activity through the Claude Code connector.
-
Monthly spend trend
A line chart shows total AI spend across the months in the selected period. -
Cost by Epic
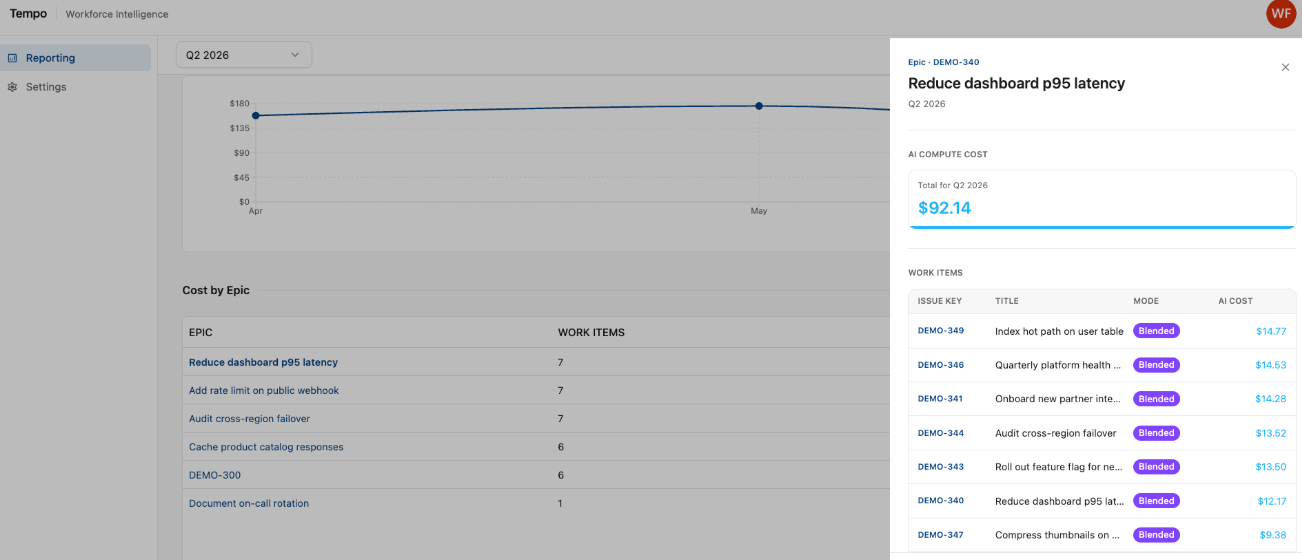
The Cost by Epic table connects AI compute and human labor cost to the Epics on your roadmap. For the first time, a CTO can see not just what AI tools cost but which specific initiatives that cost supported. Clicking any Epic opens a drill-down showing every work item within that Epic with its human cost, and AI cost broken out individually.
Connectors in this release
Three connectors are active in version 1.0. All connect at the organization level from the Settings > Connectors view.
-
GitHub
Work item attribution for GitHub activity. Every pull request, commit, and review comment WI ingests is scanned for a Jira issue key in the branch name, PR title, and commit message; the first match wires that event to the matching work item.
-
Claude Code
Captures AI tool activity and session timing for engineers using Claude Code inside an editor or via the command line. Org-level deployment with individual opt-out available. Opt-out status is visible to WI Users as a coverage indicator only.