
Executive Reporting gives engineering leaders the data they need to answer questions about AI spending:
-
How much is being spent?
-
How is spending trending over time?
-
What initiatives are tied to AI spending?
AI Investment KPIs
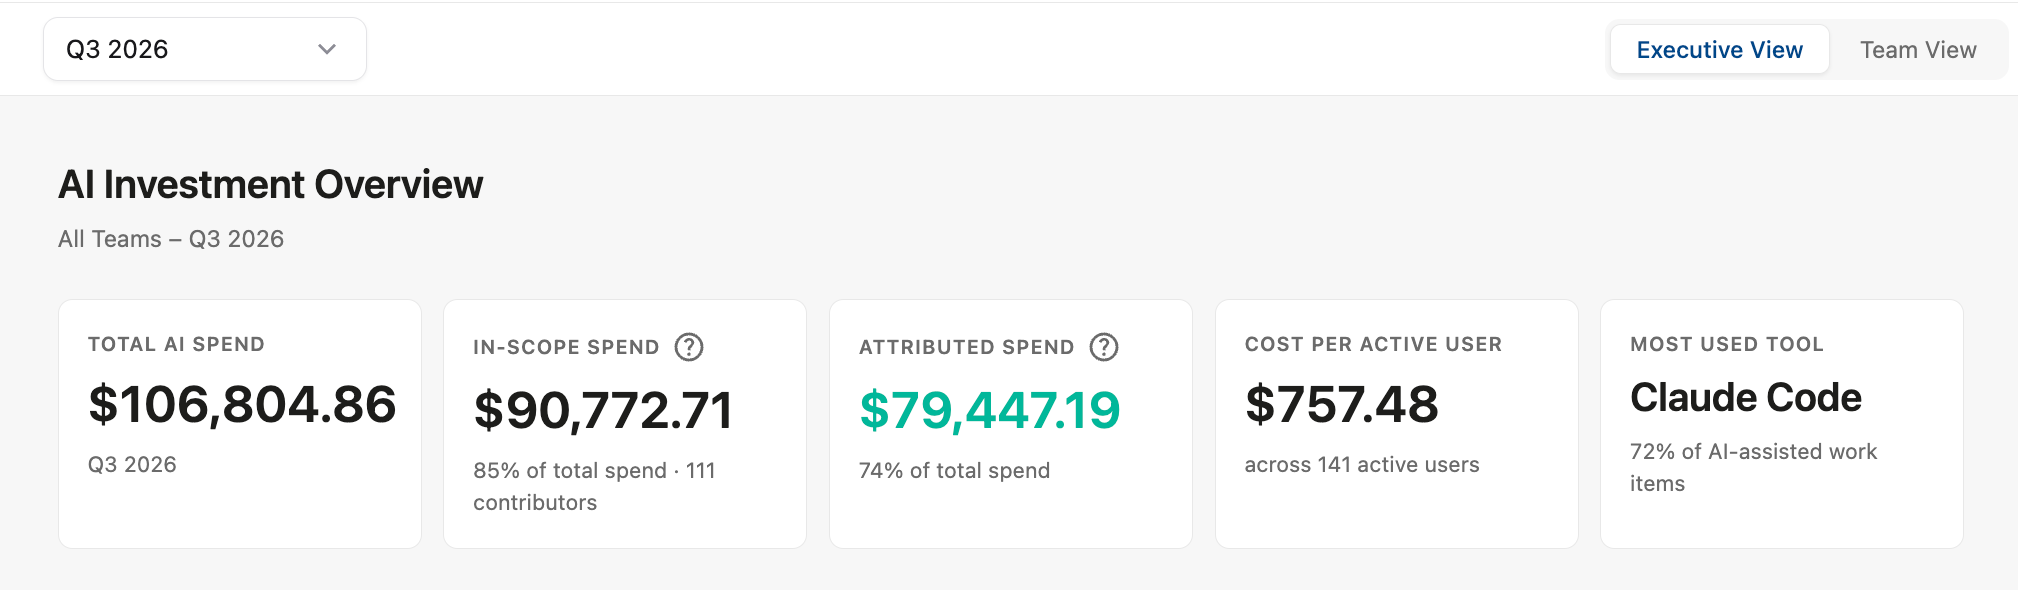
Four headline cards give CTOs and executives an immediate read on AI spend for the period:
-
Total AI spend - the total AI spend across connected AI tools
-
In-scope spend - the spend by users with both Claude Code and GitHub identities
-
Attributed spend - the share of AI spend that is linked to Jira work items
-
Cost per active user - the total AI spend for the selected period divided by the number of active users
-
Most used tool - based on AI-assisted Jira work items
AI Spend by Tool
This bar chart shows total AI spend for the period, broken down by each connected tool and sorted by spend.

This release covers Claude usage through the Anthropic Console connector and Claude Code activity through the Claude Code connector.
Monthly Spend Trend
The Monthly Spend Trend chart shows total AI spending by month over the selected period.

Cost by Epic
The Cost by Epic table connects AI compute costs to the Epics on your roadmap. This enables the CTO to see not just what AI tools cost, but which specific initiatives are being supported by that spend.
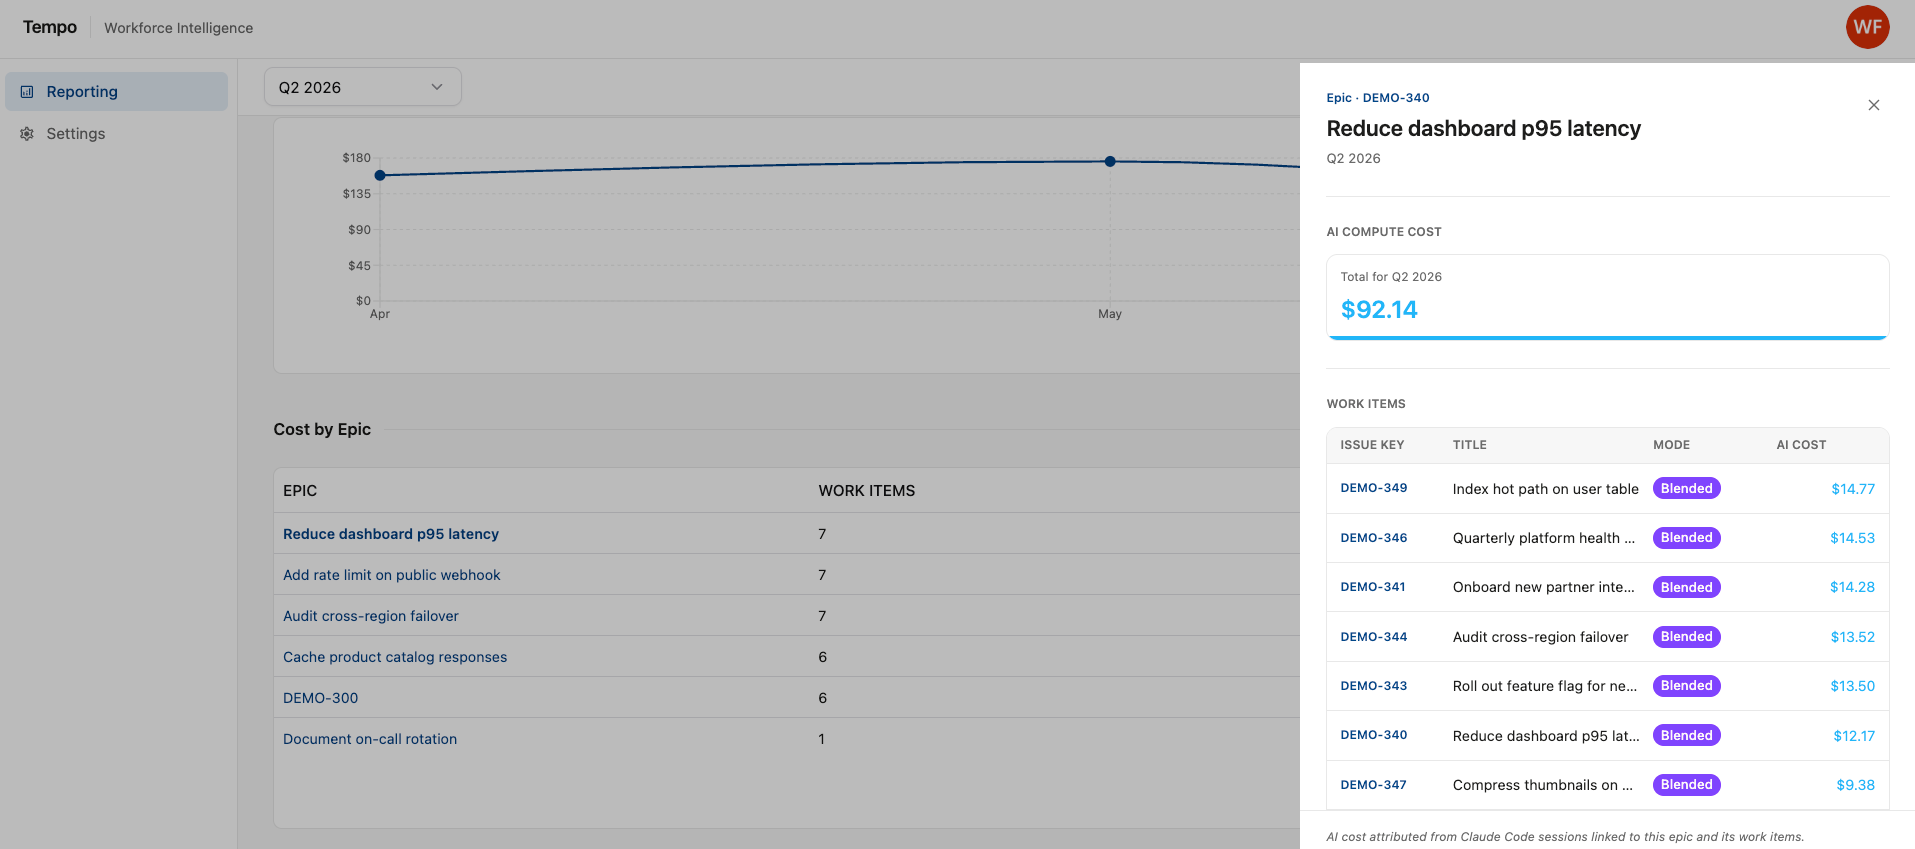
Clicking an epic opens a drill-down panel that displays all the child work items linked to the epic, along with the total AI cost attributed to each child work item.