
Team Reporting gives engineering leaders the data they need to answer questions about AI adoption and productivity without assembling it manually from multiple sources.
AI Adoption and Cycle Time KPIs
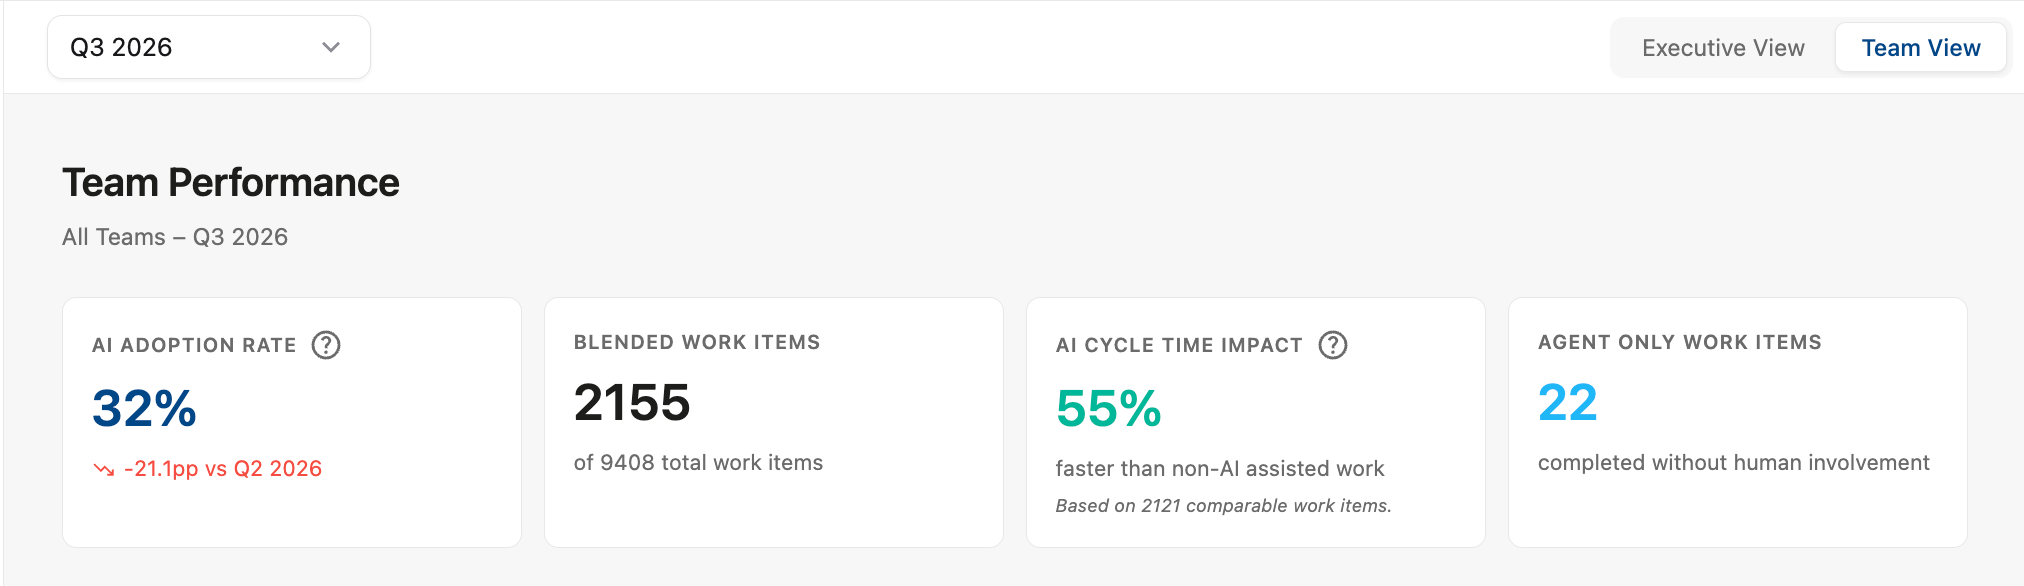
Four headline cards give team leads an immediate read on the period:
-
AI adoption rate - the share of completed work that involved an AI coding tool, as well as how this compares to the previous period
-
Blended work items - the number of work items with human and AI contributions
-
AI cycle time impact - how much faster AI-assisted work was completing compared to non-AI-assisted work
-
Agent-only work items - the number of work items with activity authored by a bot without human contribution
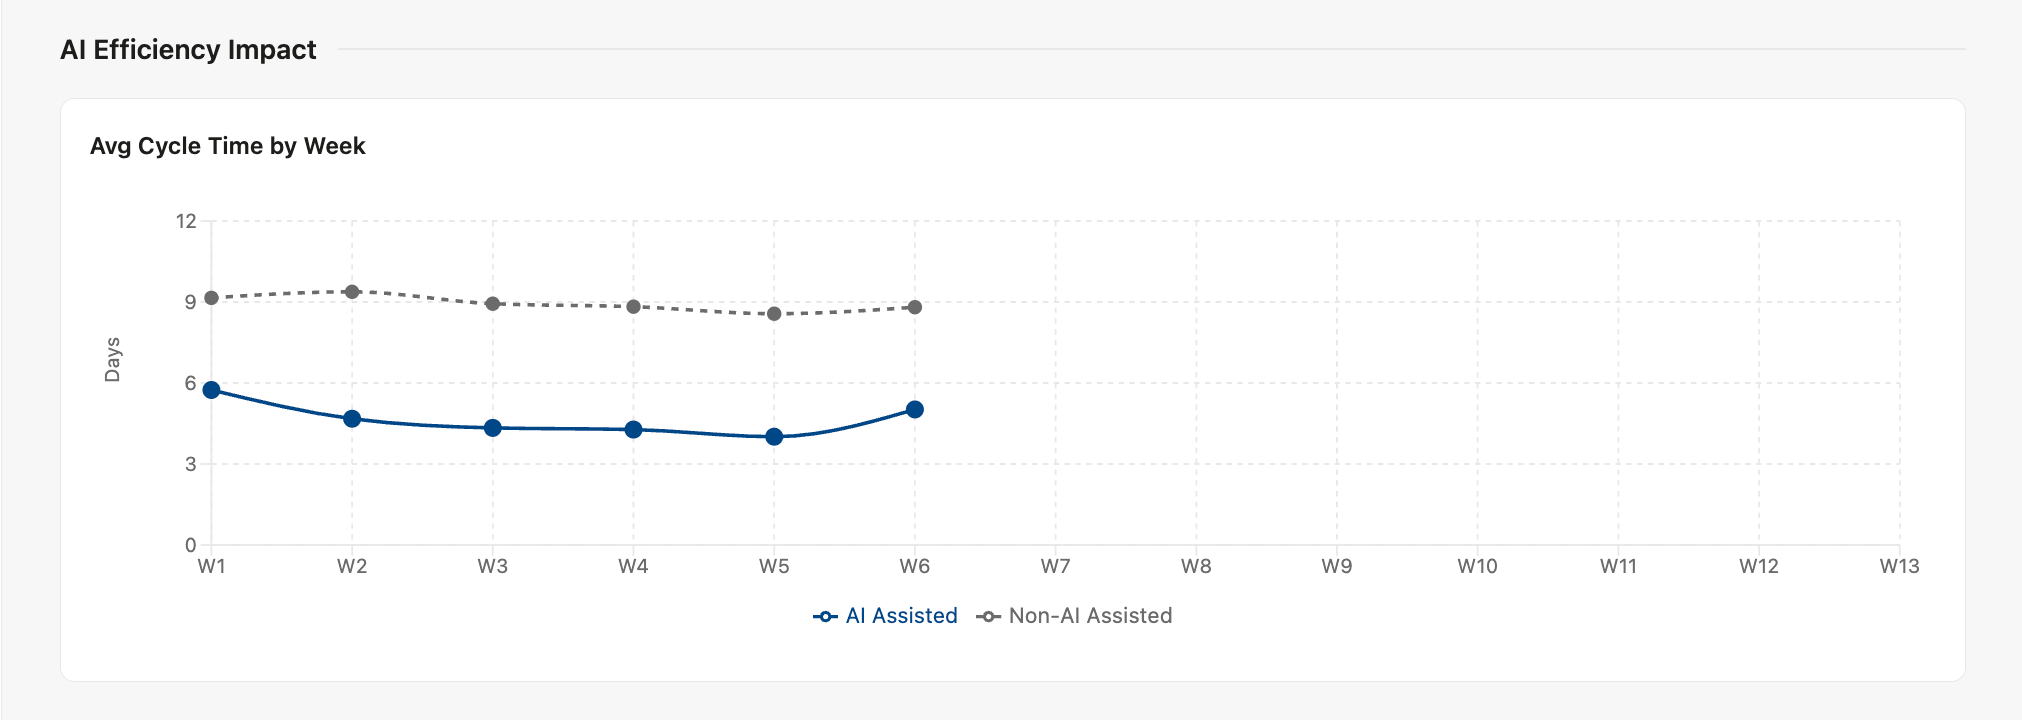
Cycle Time Trend Chart
The 12-week trend chart compares average cycle times for AI-assisted and non-AI-assisted work. The widening or narrowing gap between the two lines is the efficiency story for the period.
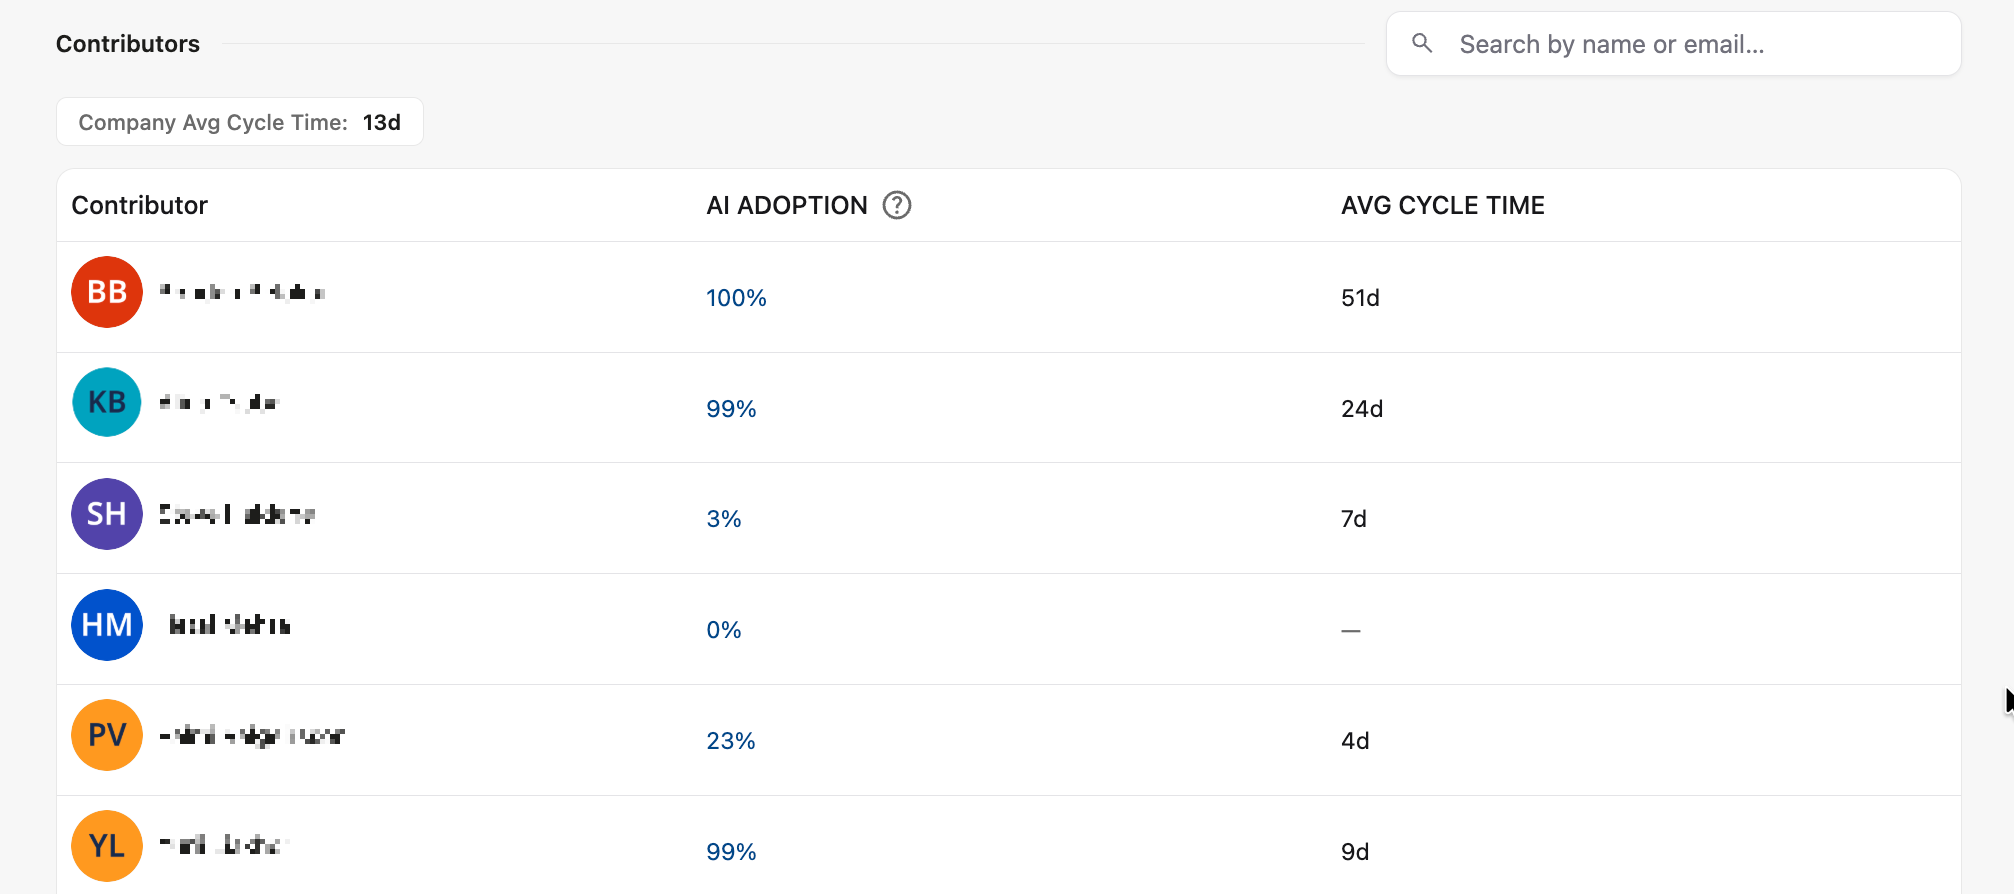
Contributors
The contributor breakdown provides engineering leaders with visibility into how individuals are adopting AI tools and how their adoption is impacting their delivery cycle times.
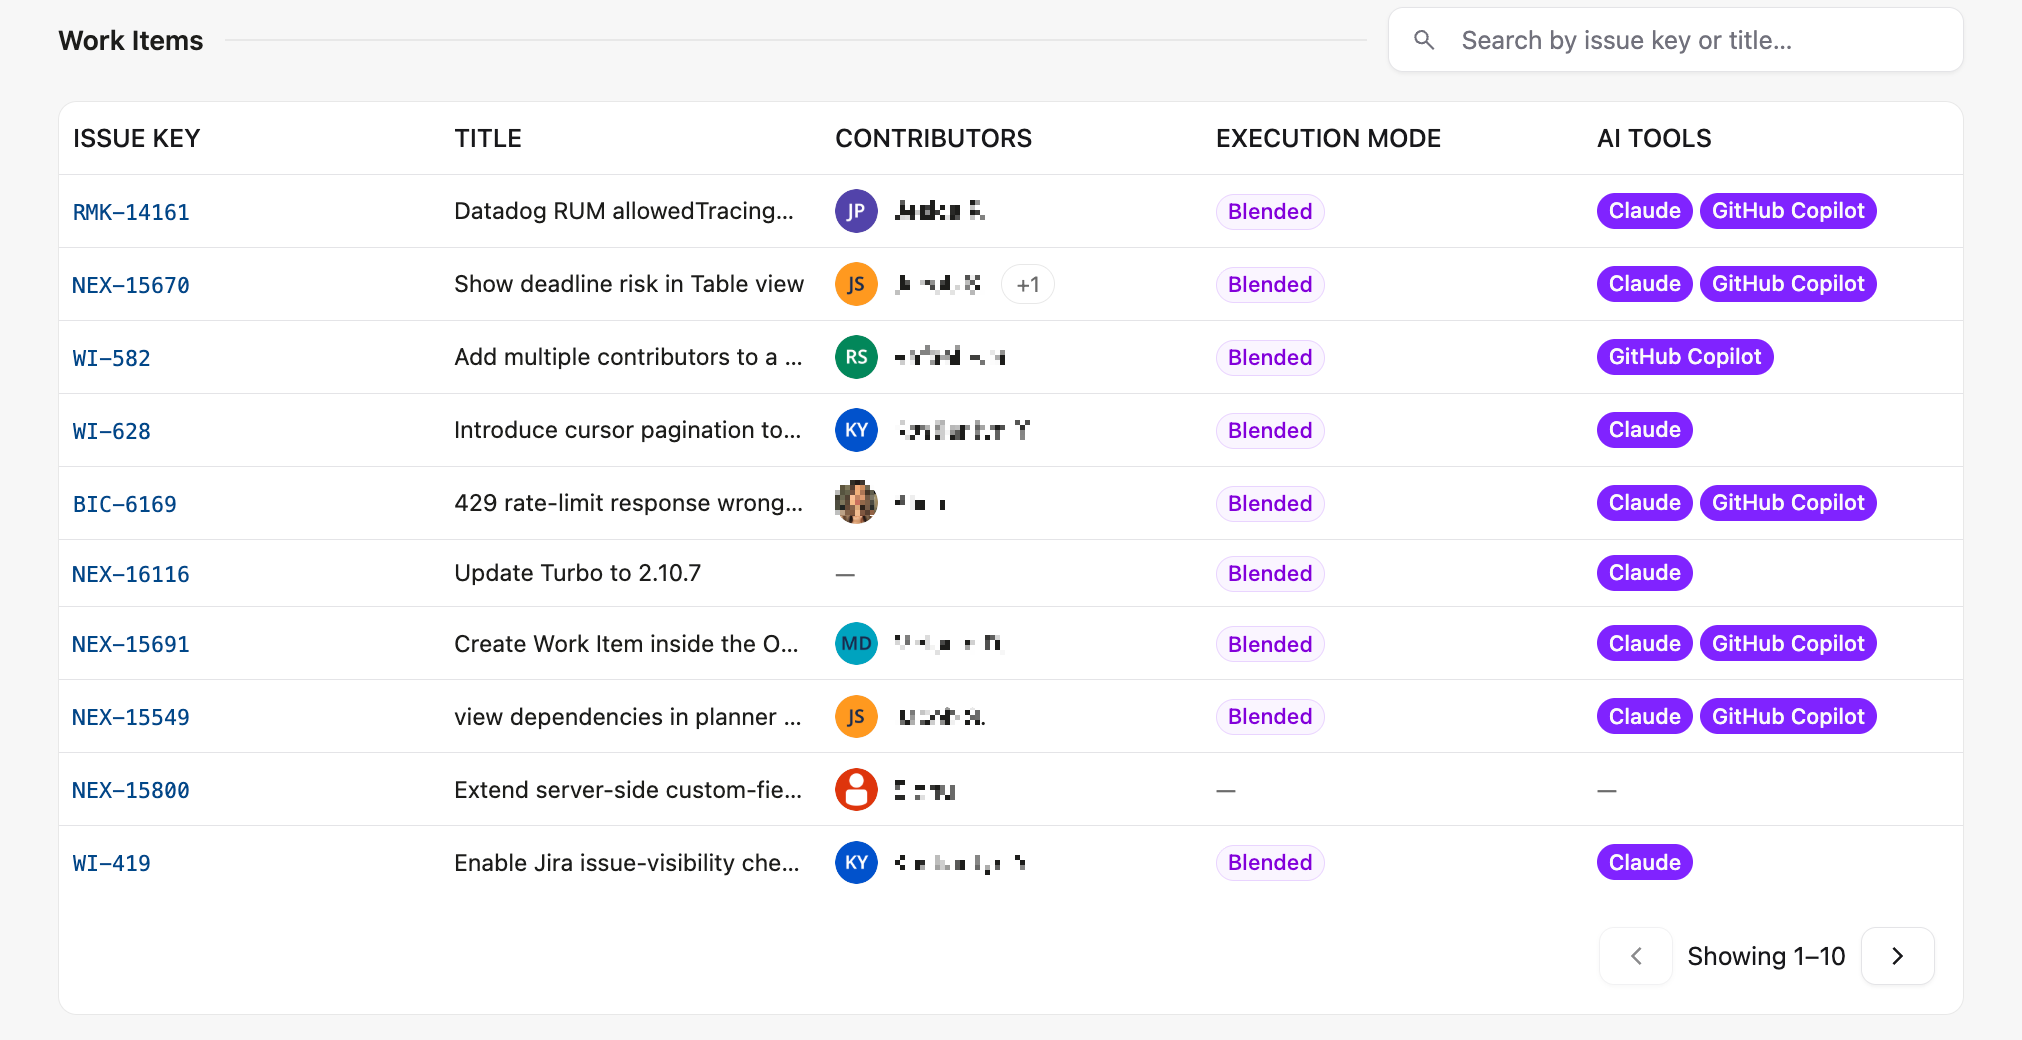
Work Items Table
The Work Items table shows every completed work item for the period, along with information about each item’s contributors and AI usage.
Clicking any issue key in the Work Items table opens a drill-down panel with additional details about the work item.
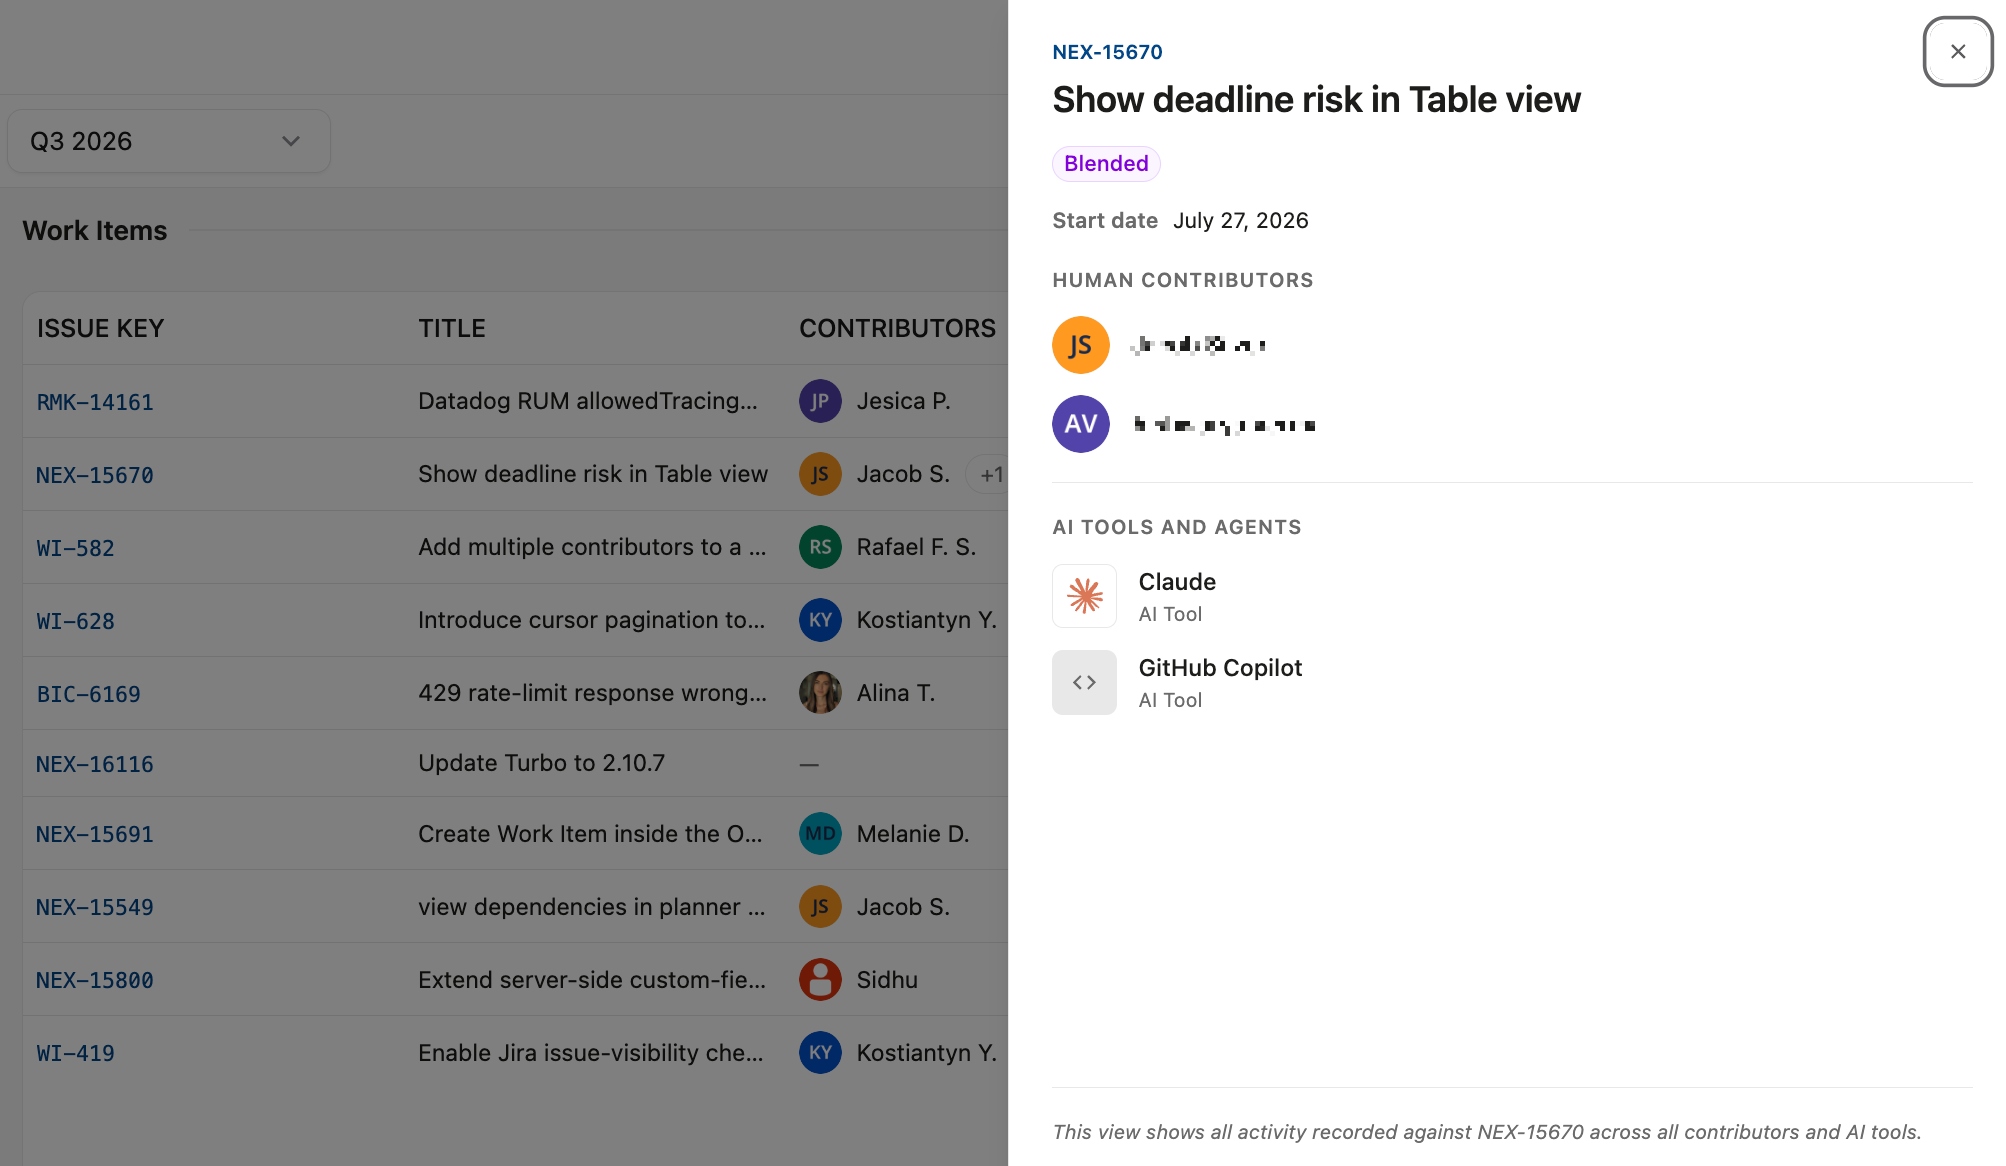
The Work Item panel is read-only.